Between cancer treatments (for my wife) and some serious IT issues I didn’t manage a post last week, and have a bit of a conundrum this week as the post I’d ideally like to have published today would have involved too many charts and and an likely indigestibly large quantity of numbers for a single post. I’ve given this some thought and have decided to do three posts this week. The first one today will look at short term prospects for the market and the implications of the weekly candle last week coming off the weekly upper band ride that has likely just ended.
The second one tomorrow will look at changes on SPX since this post and the January Barometer with the implications of the red close for January on SPX last week. In brief the historical stats tell us that the chances of a red close in 2020 have increased from the normal 27% or so to about 42%, though I’d note that this still gives the odds of a green close for 2020 at about 58%, so it might be a bit early for bears to be ordering in foie gras and champagne. The stat is actually for a decline from the January close, but as the decline in January was less than 0.2% the effect is much the same.
The third post, currently planned for Friday, will have a look at the numbers for the coronavirus outbreak and attempt to assess the chances of this becoming a serious issue. The numbers are interesting and haven’t really had enough attention in my view, and just as something to consider before I publish that post, I’d invite you to keep an eye on the outbreak numbers on the excellent John Hopkins Coronavirus Dashboard which updates a couple of times a day, and bear in mind that the numbers that you are seeing are ten to fourteen days out of date. Why is that? Well that is the incubation period for the virus. Given that the number of confirmed cases has quadrupled in the last seven days that is certainly food for thought, as that means the true figure today may be closer to 400k cases now and might be well over a million cases in another week if the limited efforts to contain the spread of the virus until seven days ago (the start of the incubation period for the confirmed cases we should see in a week) were ineffective. This issue may be just getting started, and it is certainly way too early as yet to dismiss this as the usual news storm that is here today and gone tomorrow.
One other thing to mention is that if you missed our free monthly public Chart Chat at theartofchart.net on Sunday then the recording is posted on our February Free Webinars page, so you can see that there. On to today’s post.
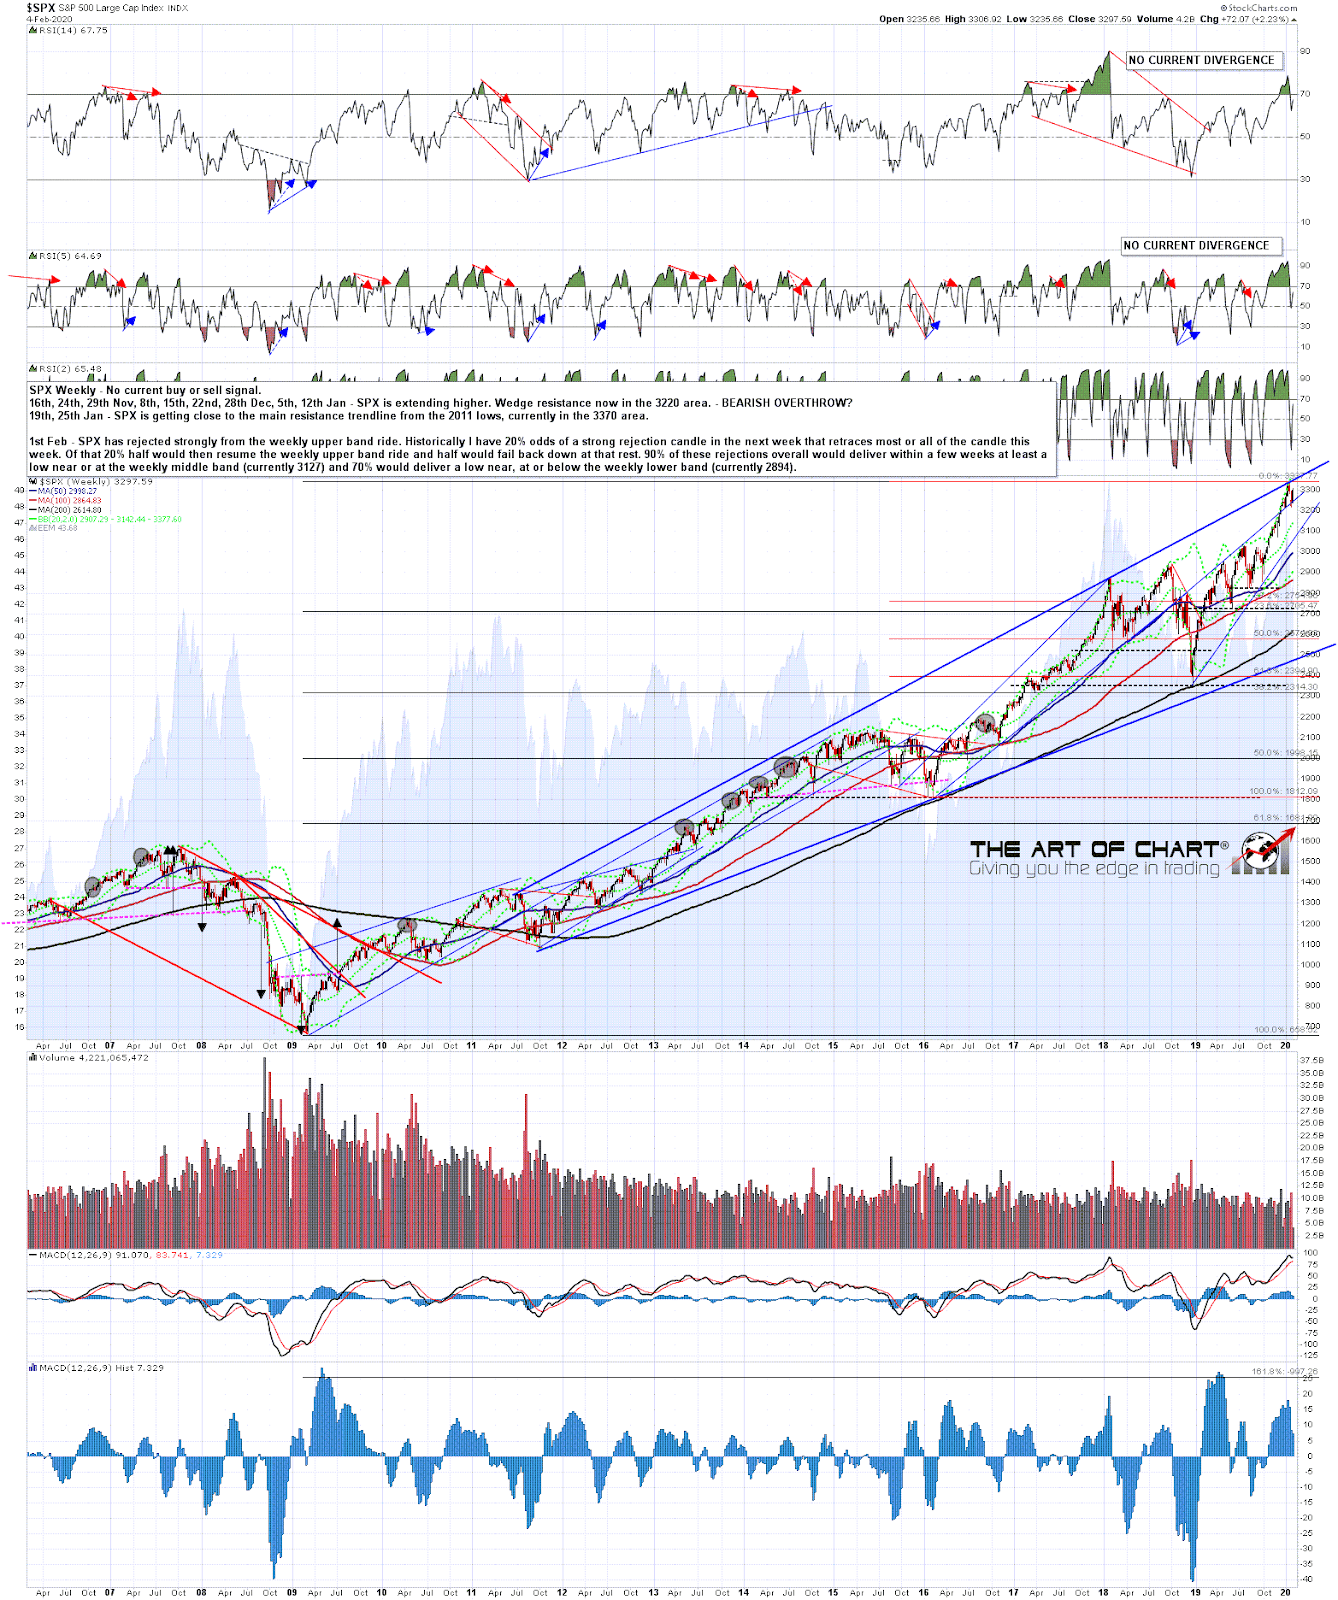
I was looking at last week’s candle at the weekend and that was a strong weekly candle down from an extended weekly upper band ride. These aren’t particularly common so I had a look at what happened after similar candles over the last decade and came up with the following.
After a candle like this there is a 20% chance of a rejection candle the following week that retraces most or all of the previous weekly candle. The candle high last week was under 3300 so it seems so far at least that we are looking at one of these this week, though obviously we won’t know until the candle fixes at the close this week. When one of these candles is seen, then half of the time the longer term uptrend is resumed and the other half of the time the shorter term downtrend is resumed, giving an overall 90% chance that the candle close last week was not a low that will hold long.
In terms of downtrend targets 85% + of the time the target within a few weeks will be close to, at, or below the weekly middle band, currently in the 3142 area, and about 70% of the time the target will be close to, at, or below the weekly lower band, currently in the 2907 area. Obviously these are moving targets which are rising, but bottom line is that normally a candle like last week’s will deliver a multi-week retracement of decent size, and this is obviously a strong match with the cycle low in April that we’ve been expecting.
The coronavirus story doesn’t look likely to end soon either, so wherever this current move lands more downside seems the most likely option afterwards.
SPX weekly chart:
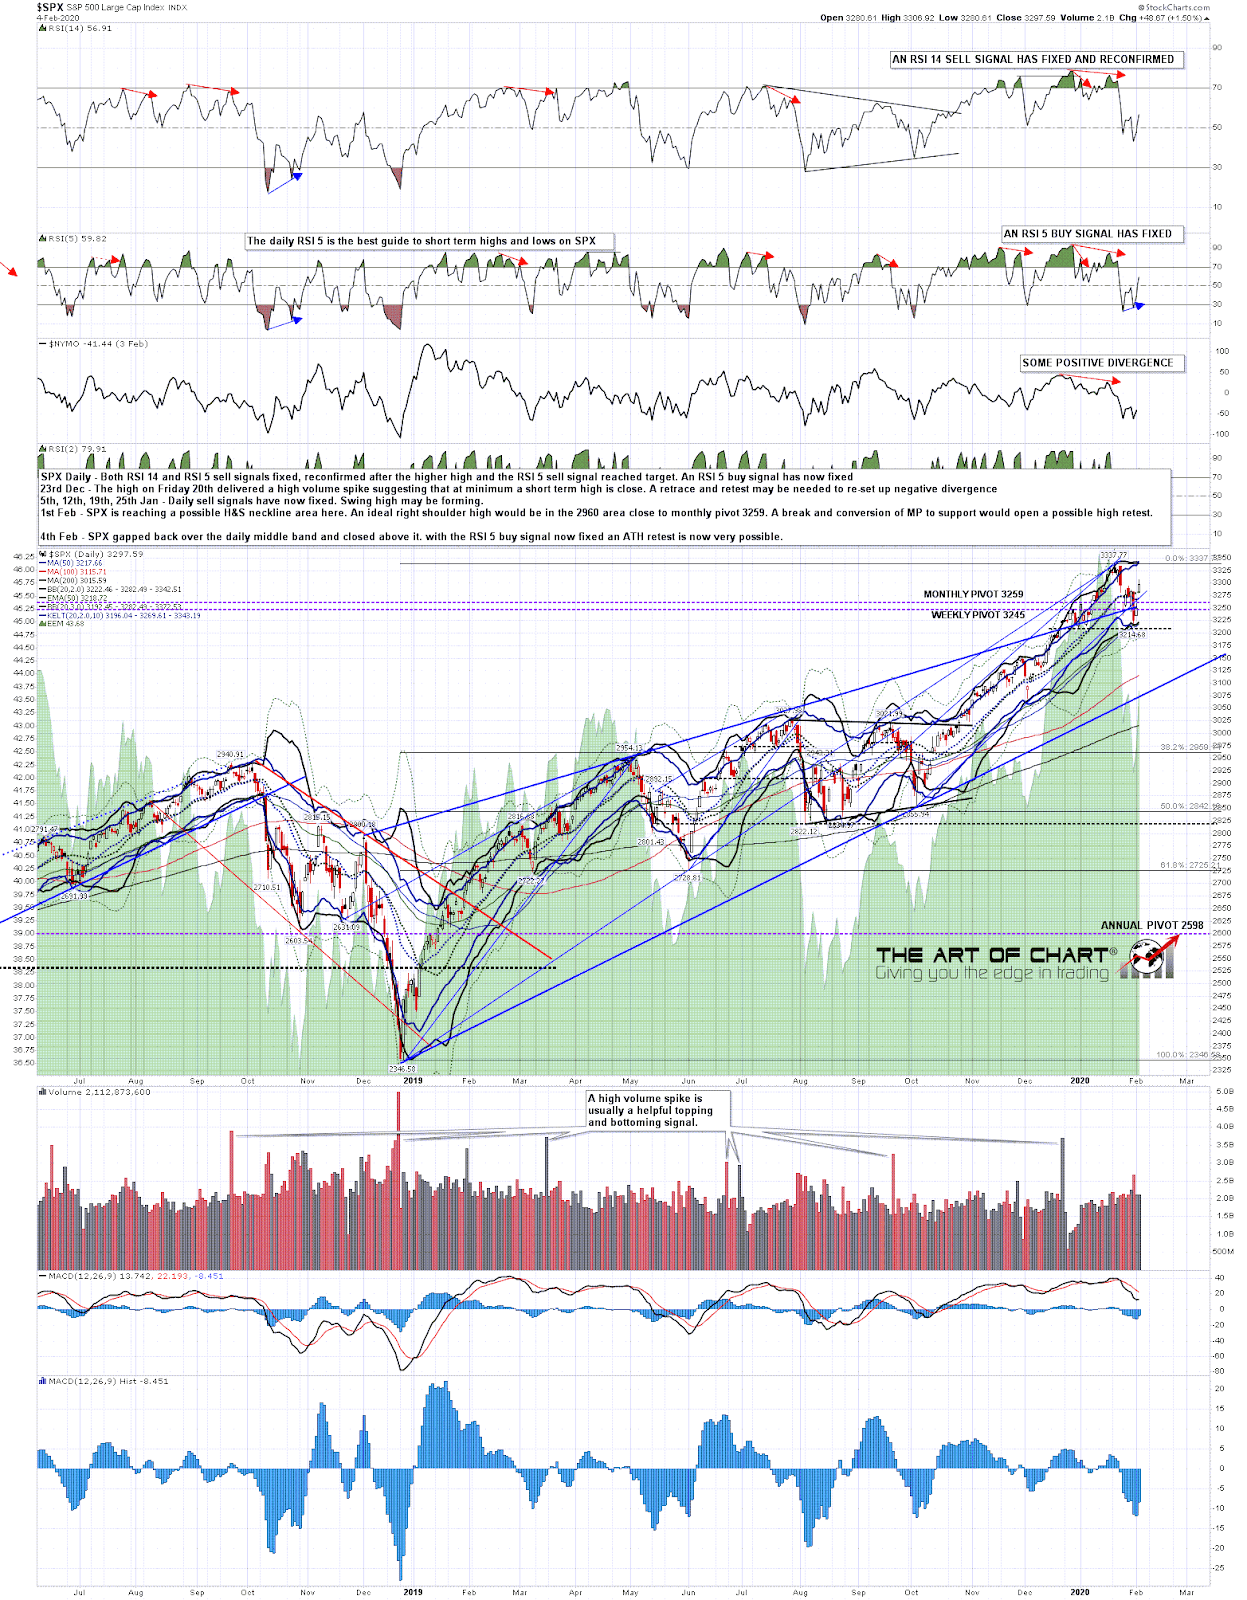
So where will this current rally land? Well I’ve mentioned before that something like 70% of significant highs and lows on SPX historically involve some kind of respectively high or low retest, so I always have a lean towards a high forming with a retest that sets up a double top. What are the prospects for that here? Well the larger RSI 14 daily sell signal hasn’t reached target, but I noted at the weekend that a shorter term possible daily RSI 5 buy signal was brewing and that has now fixed, so that is favoring more rally and a possible new all time high coming on SPX.
Also favoring that option was the gap up over the daily middle band today, currently at 3282,with that holding all day and a strong close above it at the end of the day. Decent short term resistance at the 50 hour MA was lower and therefore also strongly broken today. I’m not posting the daily 5dma chart here today but the close above the 5dma today, currently at 3266, puts SPX back on my Three Day Rule. If we see a close back below the 5dma (3+ handles below to exclude closes effectively on the support), then we should see a retest of Friday’s low soon afterwards.
SPX daily chart:
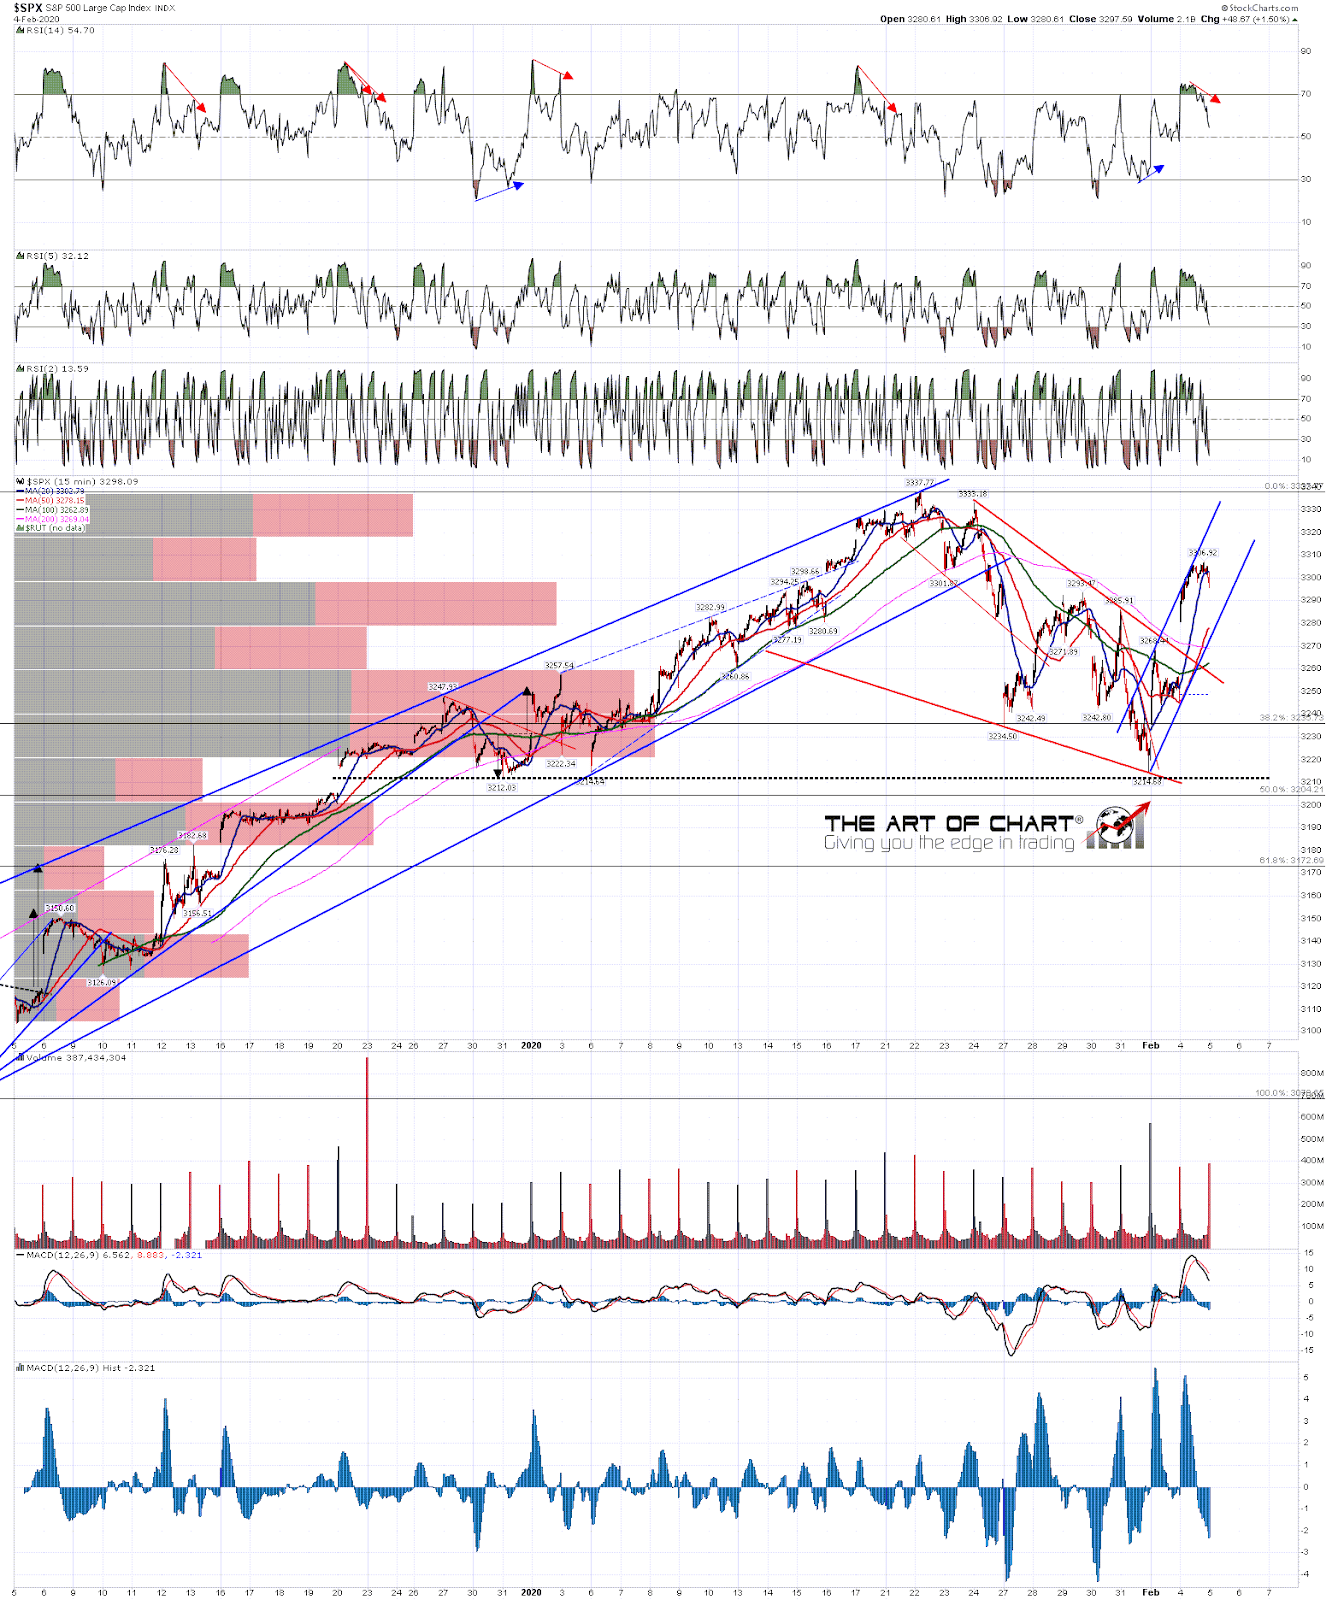
The shorter term charts favor a retest of the all time high as well in my view. The move down last week broke down from the rising wedge shown below on the 15min chart and retraced just under 50% of that wedge. When a wedge is going to fully retrace then a high retest is ideally seen from this area to set up a double top setting up that full retracement (back to 3070.33 in this instance). Last week’s decline was also within a decent quality bull flag falling wedge that broke up today with a target at the all time high retest. My lean is therefore to see that retest, ideally with a subsequent fail at a marginal higher high into the next and larger leg down.
In the short term I have a very interesting rising channel formed from Friday’s low, with a 15min RSI 14 sell signal fixed at the close today and a small double top setup looking for the mid 3280s. We may see that target made tomorrow, with a backtest of support at the daily middle band and a hit of that short term rising channel support. If that holds that channel can take us straight up into the all time high retest this week, which would be a very nice setup to trade, so I’m hoping that’s the way this plays out. We’ll see.
SPX 15min chart:
I’m planning my next post for tomorrow afternoon and by then we should see whether support has been backtested and whether it held. Until then ….. 🙂
 04th Feb 2020