When I looked a few weeks ago at the stat for the first five days of the year I found that the correlation with the yearly close there was essentially random, so I was wondering when I had a look at the full January Barometer stat whether I would find the same but was pleasantly surprised when I did not.
The numbers I was looking were from 1950 to the present, so that’s a good statistical sample, and in that time 72.86% of years closed green, and 27.14% of years closed red, with 61.43% of Januaries closing green in that time and 38.57% of them closing red.
I’ve looked at the numbers for continuation from those January closes, so in the event that January closed green, then a continuation would be that year closing higher than that January close, not just closing green for the full year, and the same for bearish continuations after a red close in January. On that basis the odds of a bullish continuation into the yearly close were 83.872%, well up from the average 72.86%, and where a January closed up over 2% then that strengthened further to 87.1% odds of the year closing up from there.
In the event of a red close in January, that delivered 40.74% odds of continuation down from there into the close for the year, up almost 50% from the average but obviously still significantly less than even odds of a red close. Now January this year closed red of course, but very marginally, only by 0.2%, so I have also had a quick look to see how many red January closes were 0.5% or less, and how they performed afterwards. Unfortunately there were no other instances so I expanded that to closes less than 1% or less and there were four. That is too few to be a reliable number really but for what that’s worth three out of those four closed red, for an average decline of 17.5%, helped along by one of them being January 1974. The other closed up less than 2% in 1984.
Overall the January Barometer is a solid stat that has delivered good results in the past and may well continue to do so in the future. On to the markets.
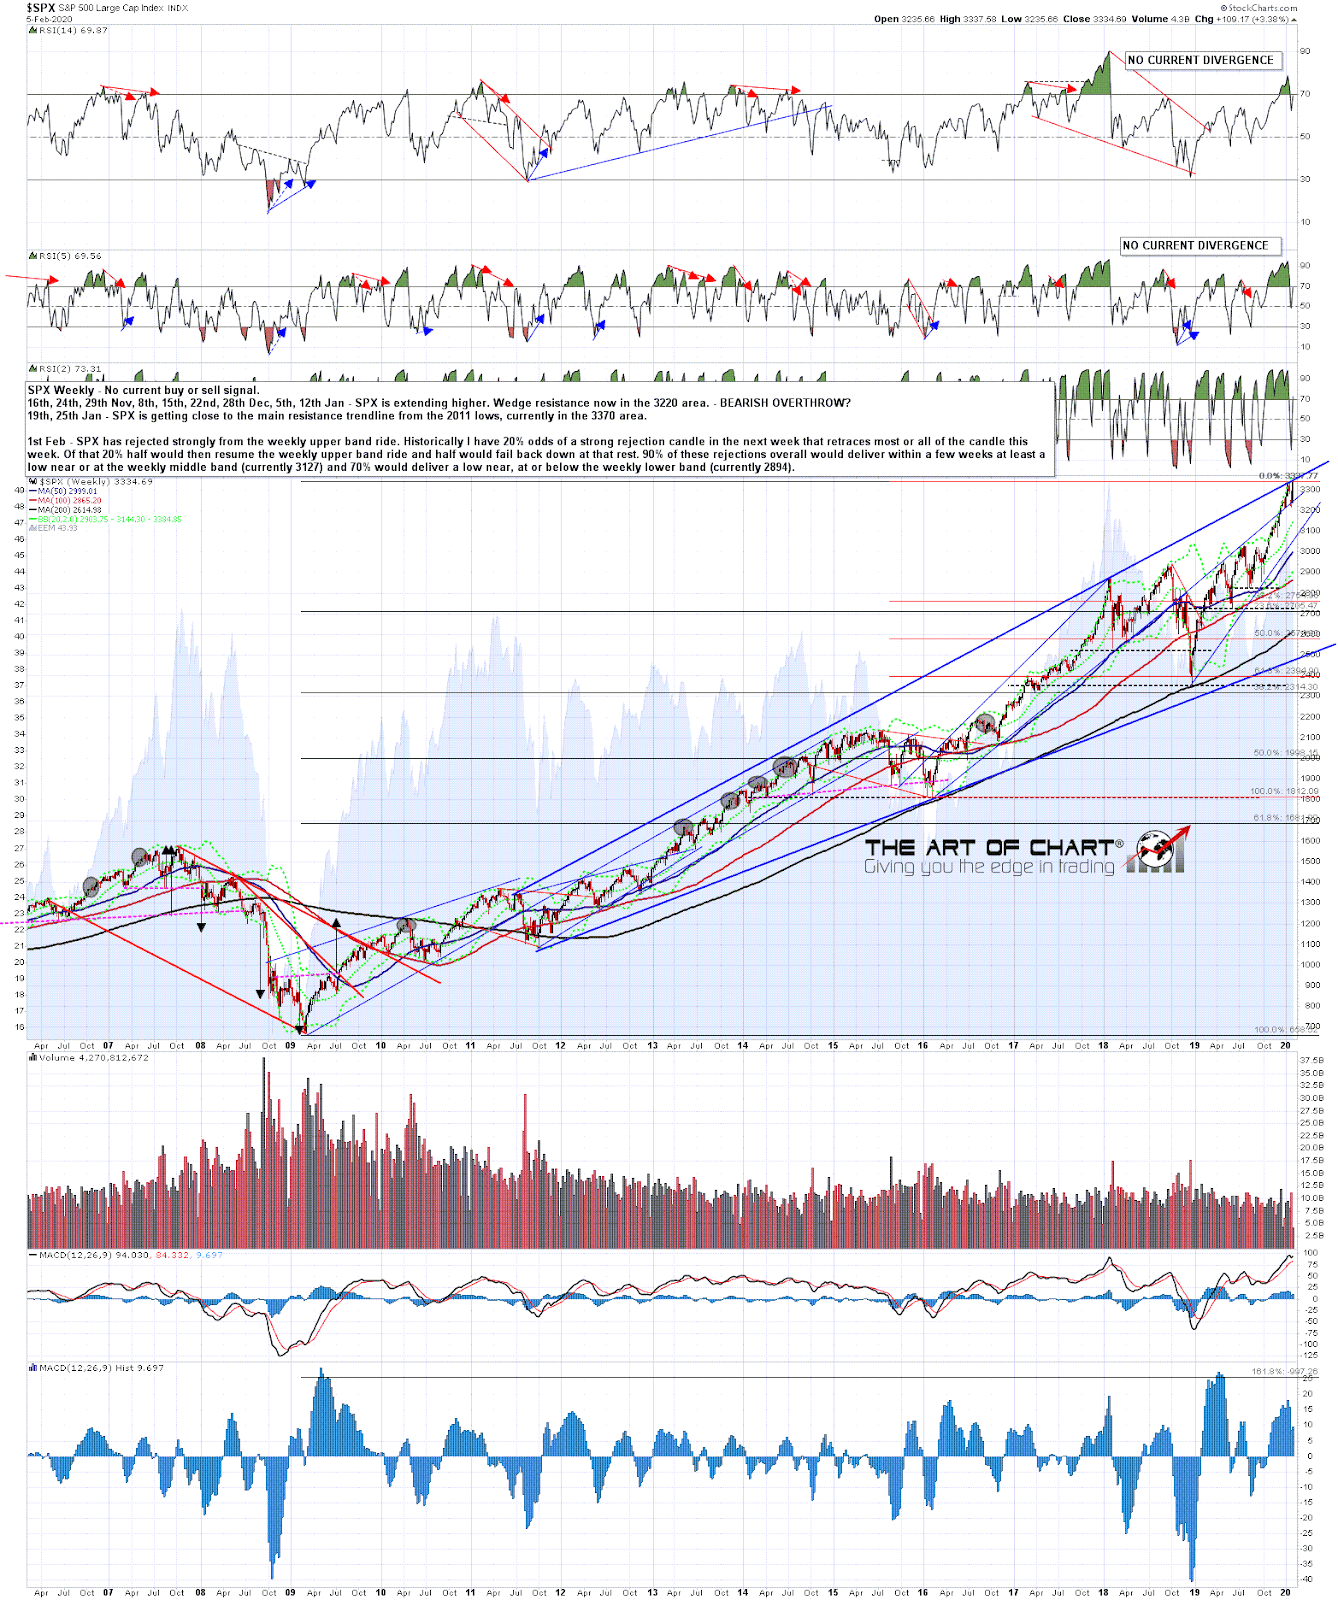
As it is likely after today’s gap up and go that we are looking at a reversal candle this week, that puts the historical odds from the last ten years at about even between continuation up to resume the broken weekly upper band ride or resumption of last week’s downtrend in the near future. For reference that would involve at least a near miss of the weekly upper band soon and that is currently in the 3385 area. A hit there in the next week or two could deliver a continuation of the strong uptrend over the last few months though I’m doubtful about that. I think the odds favor a resumption of last week’s downtrend after this spike up has blown out, though likely we will need to see a new all time high on SPX before that, which was missed by 0.19 handles at the high today, though a new all time high was made on ES after the RTH close.
SPX weekly chart:
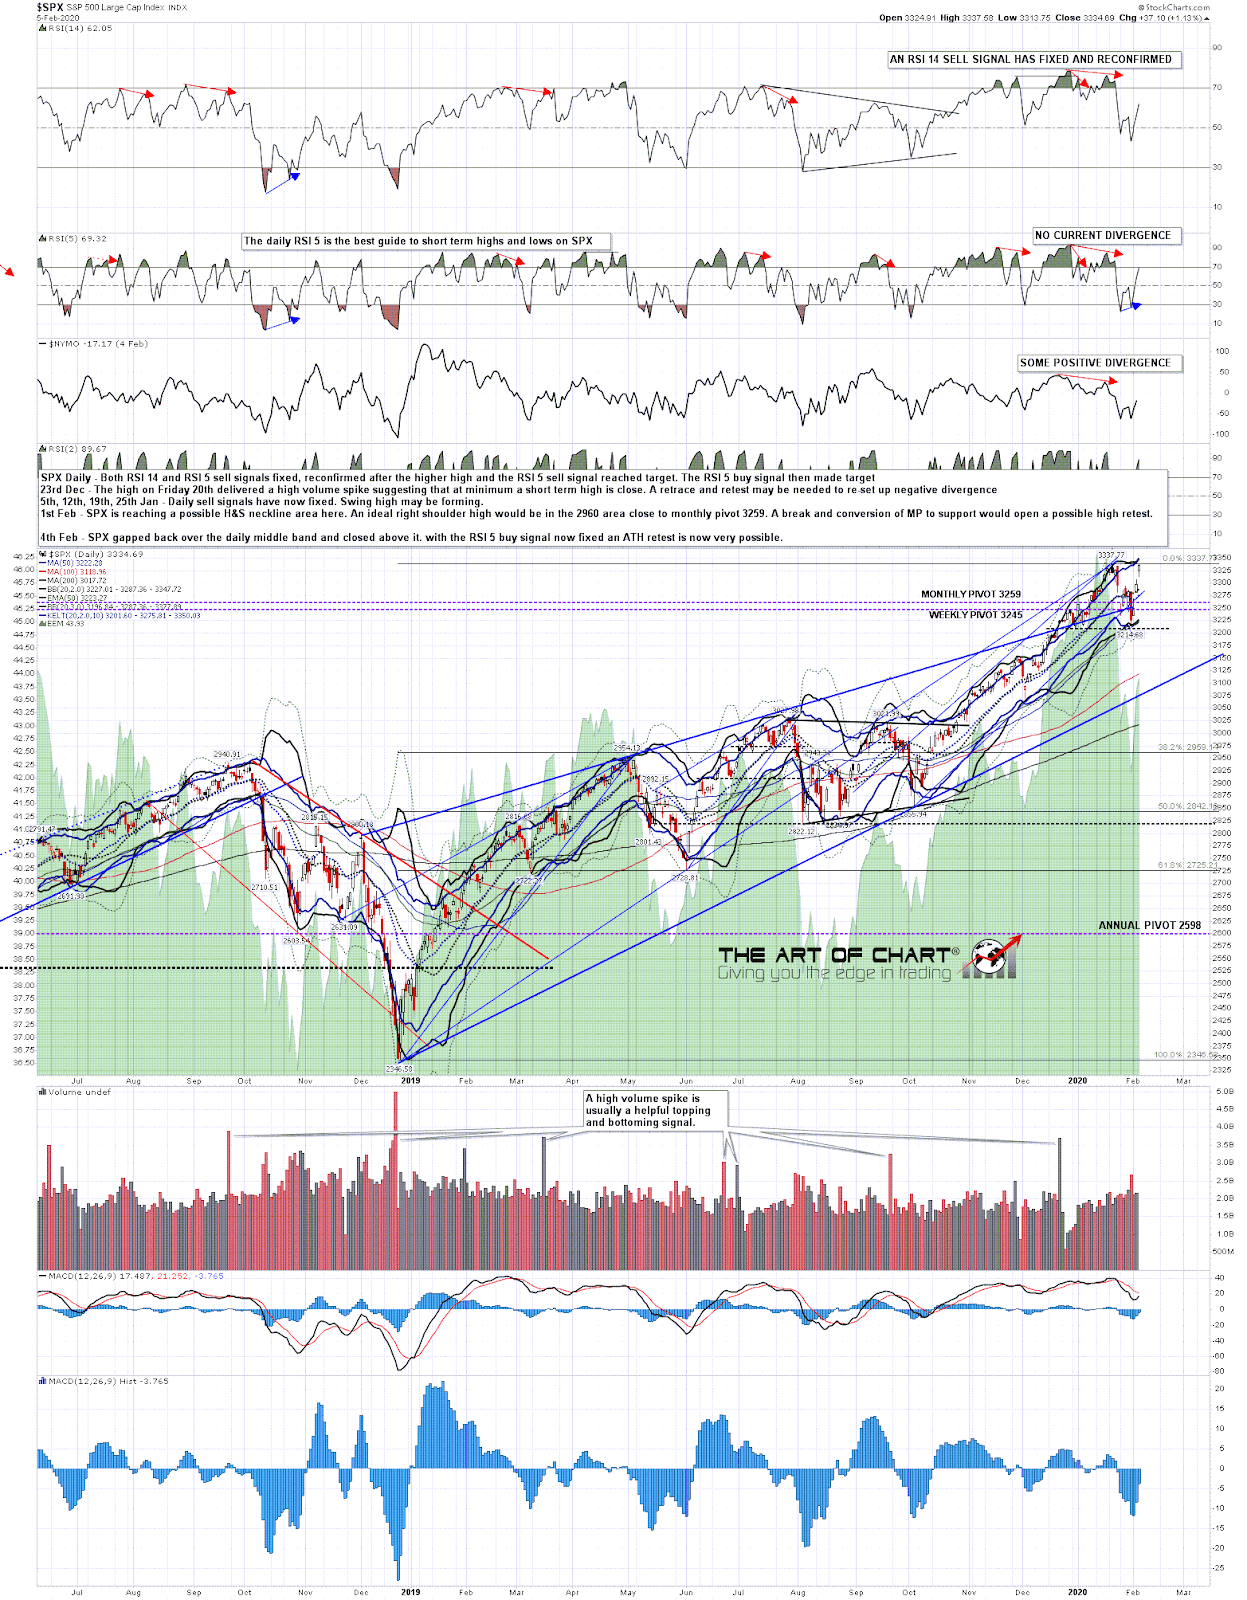
On the daily chart SPX closed over daily upper band today and we may well see the retracement we didn’t see today tomorrow instead. There is some support for that on the shorter term charts.
SPX daily chart:
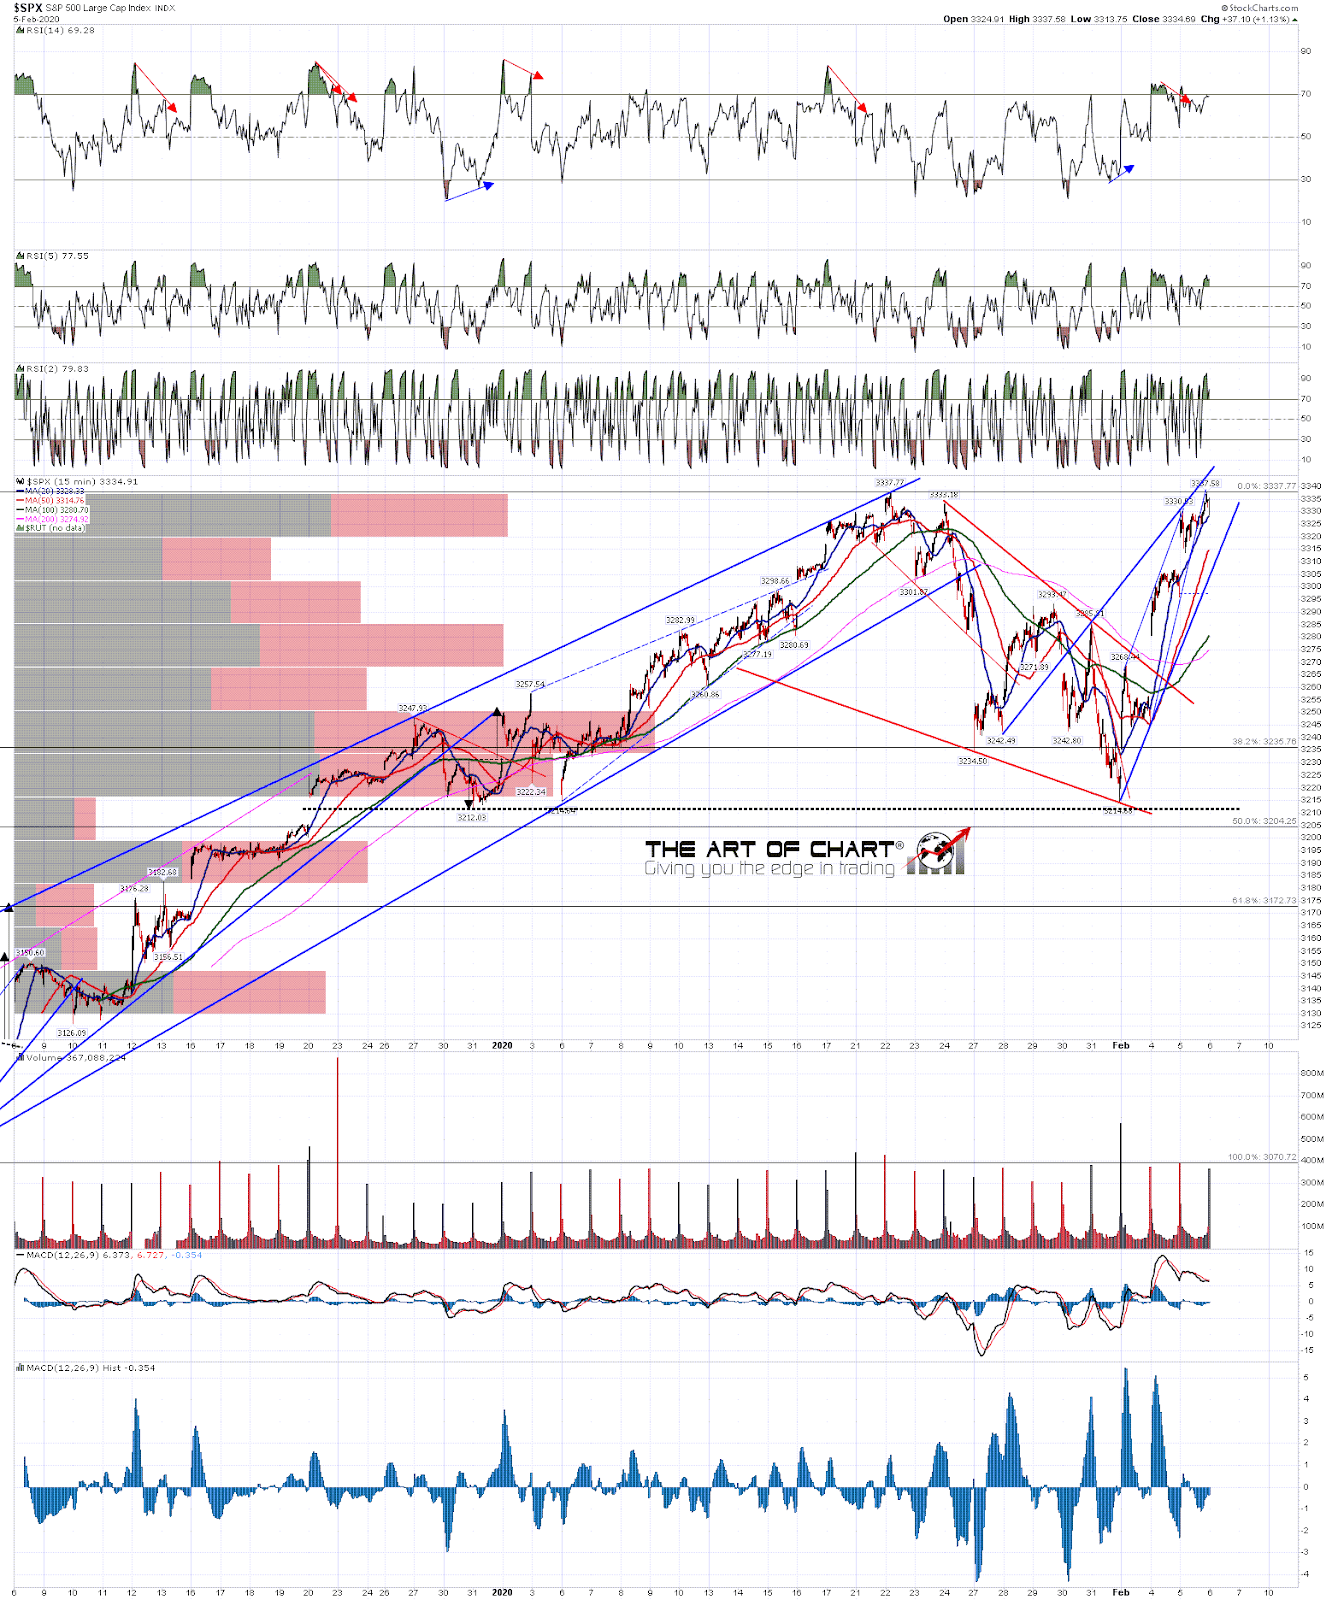
On the SPX 15min chart my channel resistance trendline was broken by the gap up this morning, and that has expanded into an even nicer rising wedge resistance trendline. If that survives tonight, unlike yesterday’s resistance trendline, then then the obvious next move would be a test of the rising support trendline from Friday’s low, which closed today in the 3305 area and is rising at about four handles per hour in regular trading hours. If that wedge support breaks then this move might be over, though I don’t think that any SPX high here that failed to make a new all time high would last long. I can’t recall any instances offhand from the last decade at least of a high on SPX lasting more than a couple of weeks where ES had made a new all time high and SPX had not.
SPX 15min chart:
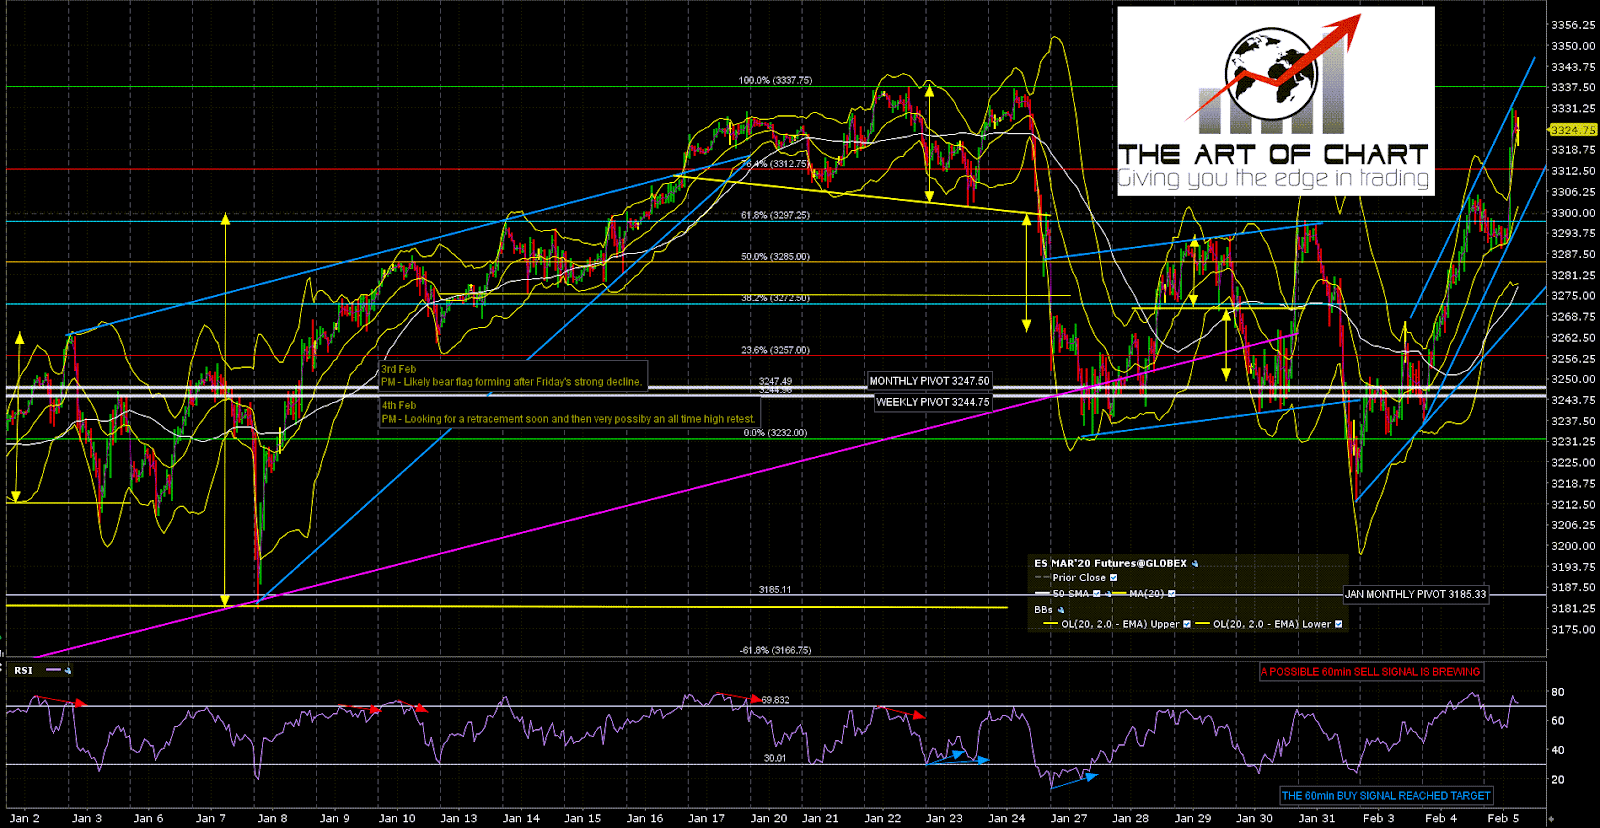
On the futures charts I have decent quality possible 60min sell signals brewing on ES, DAX and ESTX50, though obviously they would need some kind of a retracement to fix, and that negative RSI divergence might be lost soon if the equity futures continue falling upwards the way they have the last two days.
ES Mar 60min chart:
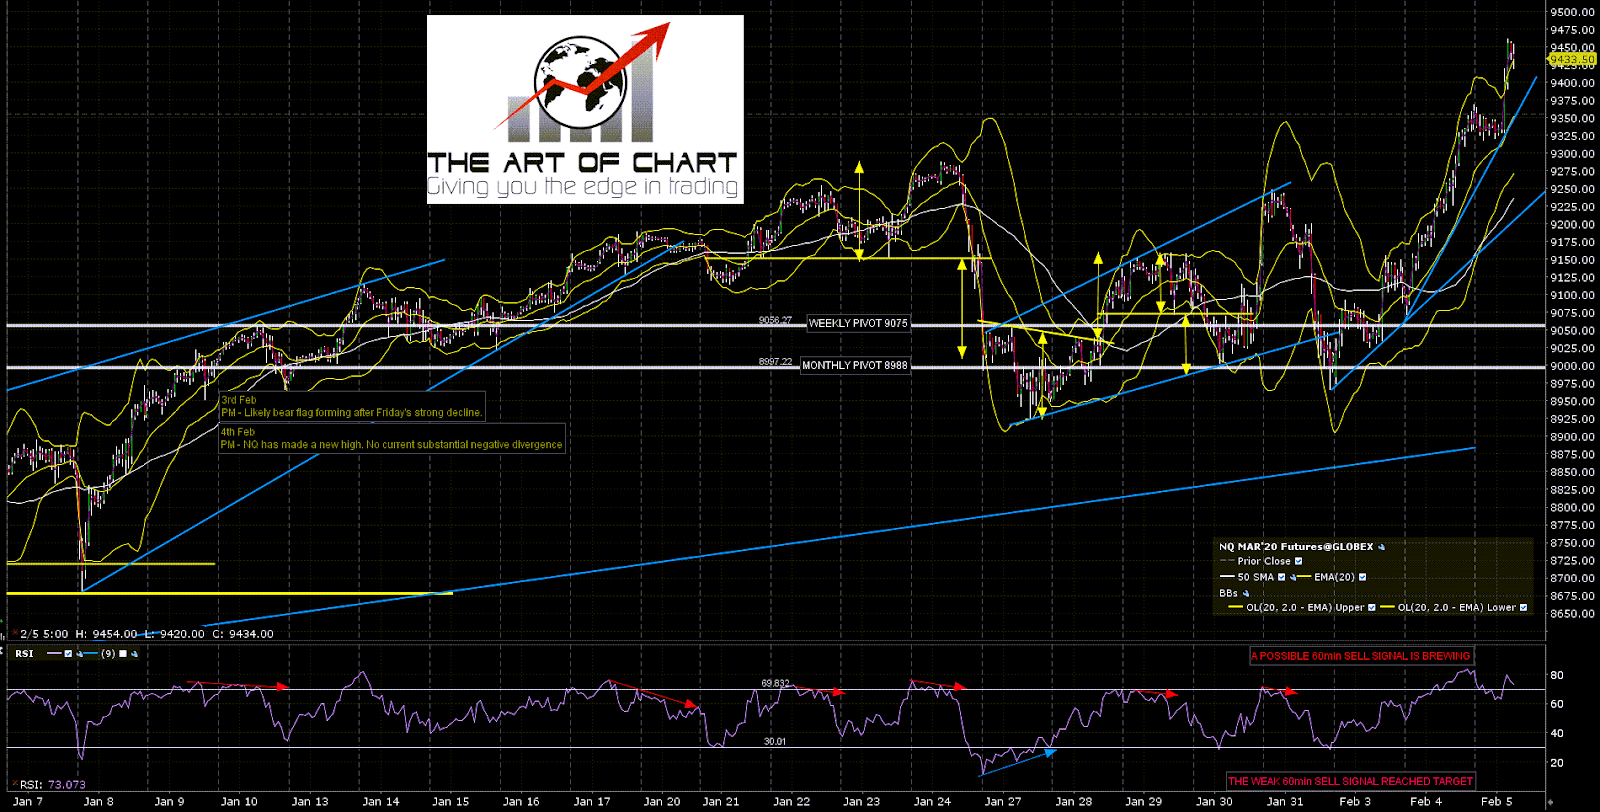
On NQ and RTY those 60min sell signals have already fixed and both of the last two retracements including last week’s move started with a 60min sell signal on NQ alone, so I’m watching that with particular interest.
NQ Mar 60min:
My lean is towards more downside and that’s only in part because I’m not seeing any evidence that the coronavirus situation isn’t likely to get a lot grimmer over coming weeks, if only because the virus incubation period almost guarantees that the confirmed case numbers are likely to get at minimum an order of magnitude larger.
That being said, there is never any certainty in market action and this has been a very persistent uptrend, perhaps because (not officially) QE4 has been pouring record amounts of liquidity into markets since October. That’s still ongoing and China has added another $250bn of liquidity and stimulus to that this week. That’s a lot of money and it that’s certainly been having a strong impact since yesterday’s pre-market announcement from China delivered the strong gap up yesterday morning.
On Friday I’m planning the third post this week crunching the coronavirus numbers and considering the virus news. I’ll be doing a market update then too, so by that stage we should have a better idea whether any retracement is possible on equities this week other than the impressive retracement we finally saw on TSLA today.
 05th Feb 2020