It’s been an exciting week, with wild moves, bold pronouncements about markets, terrible economic news, expectations about interventions by governments, the number of US confirmed cases of COVID-19 climbing over a million, deaths from COVID-19 in the US climbing over 60,000 and over 235,000 worldwide. Exhausting and TGIF.
So what happened on the SPX over the course of the week? Well SPX closed last Friday at 2836.74, and closed tonight at 2830.71, so it dropped 6.03 handles over the week. Like a rollercoaster it was a wild ride that ultimately stopped sedately back where it started.

I did a post earlier this week looking at past backtests of the SPX monthly middle band and the close yesterday at the end of April was a visually obvious close slightly back over the monthly middle band, which has been a rare event, so I’ve had a look at time when this has happened in the past and, with a warning that a statistical sample of four is really very small, here are the four comparable occasions when this has happened in the past.
Marginal visual closes back over monthly middle band
- Q2 1939 – Close below following month, then six closes over mid band into lower high then lower low.
- Q2 1960 – Higher low following month, then retest same level and close below mid band, then lower lows
- Q3 1981 – Direct fail into lower lows
- Q1 2019 – Immediate conversion of middle band into support then higher highs
So what’s the take-away here? Well three of these four obviously failed to deliver a new high before lower lows, and the 2019 sample is now looking suspect because on the first day of the next month SPX then opened above the monthly middle band and never closed a day back below it, something SPX has clearly already failed to manage here, but this close was strong enough to suggest that after this retracement SPX may be able to climb back over the middle band and trade above it for a while before then likely heading towards lower lows, which is what happened in the case of 21 of all the 24 backtests that I identified, and in 5 out of the 5 cases I was looking at where there had been an economic shock comparable to the one still being delivered by COVID-19.
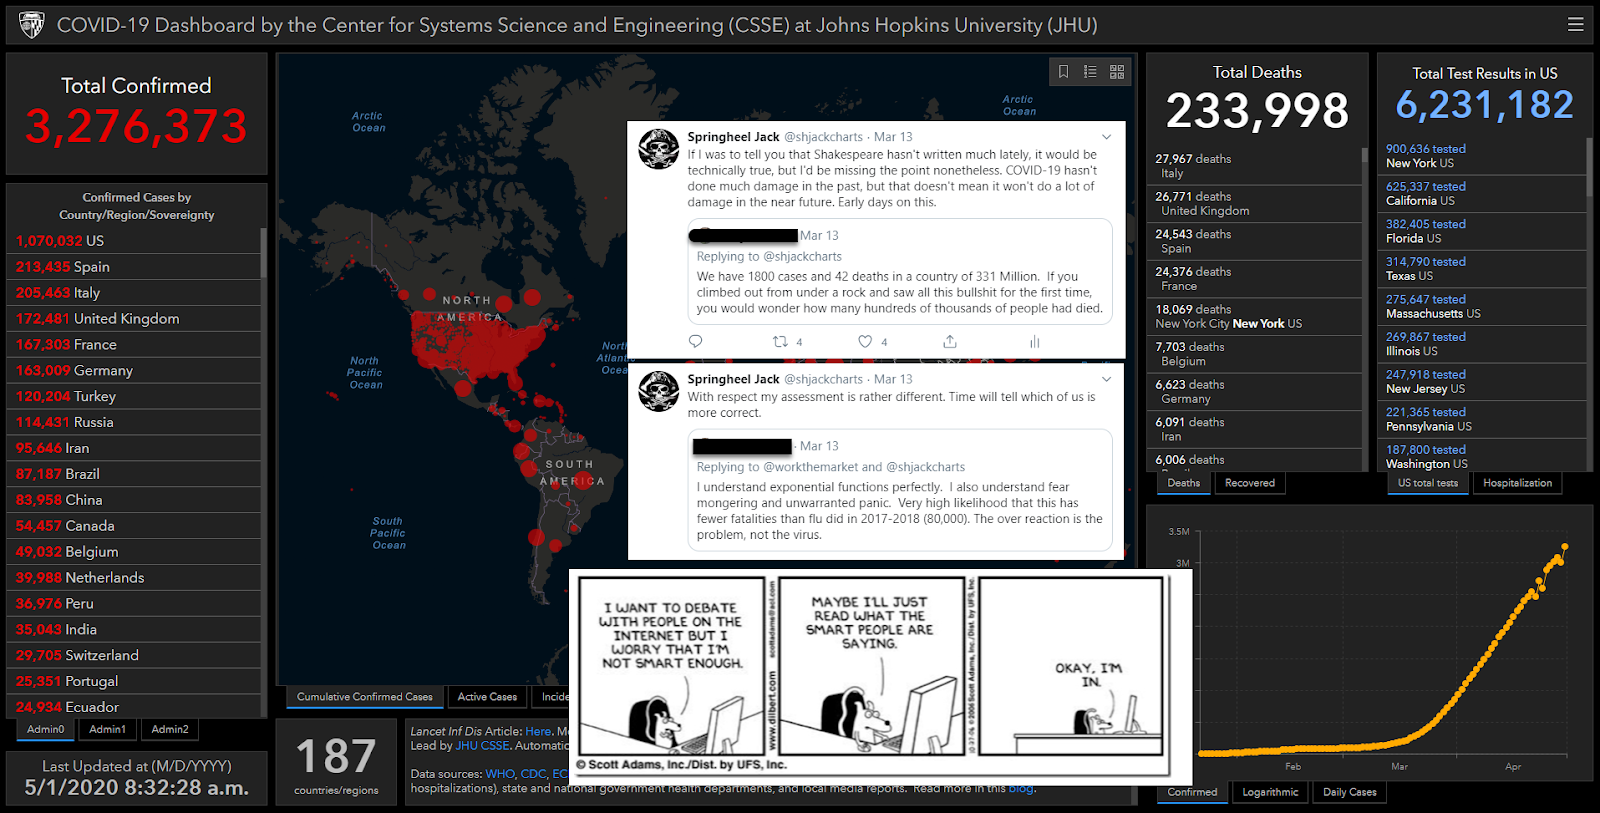
Personally I still think the COVID-19 story is still playing out and, while the world may now be past the peak of the first wave of this, the crisis is both medically and economically a long way from reaching the rearview mirror. That said, that’s just my opinion, and there are plenty of others that disagree, but they wouldn’t be the first ones to seriously underestimate this:
On to the markets, how are we looking on the current retracement from Wednesday’s highs?
On the 15min chart the rising wedge has obviously broken down and fell directly though the 2860 area I thought might deliver a right shoulder rally for an H&S. Looking at the chart that area might well be resistance for a rally on Monday, if we see one. The next really big level support on the SPX chart is the much larger possible H&S neckline in the 2727 area.
SPX 15min chart:
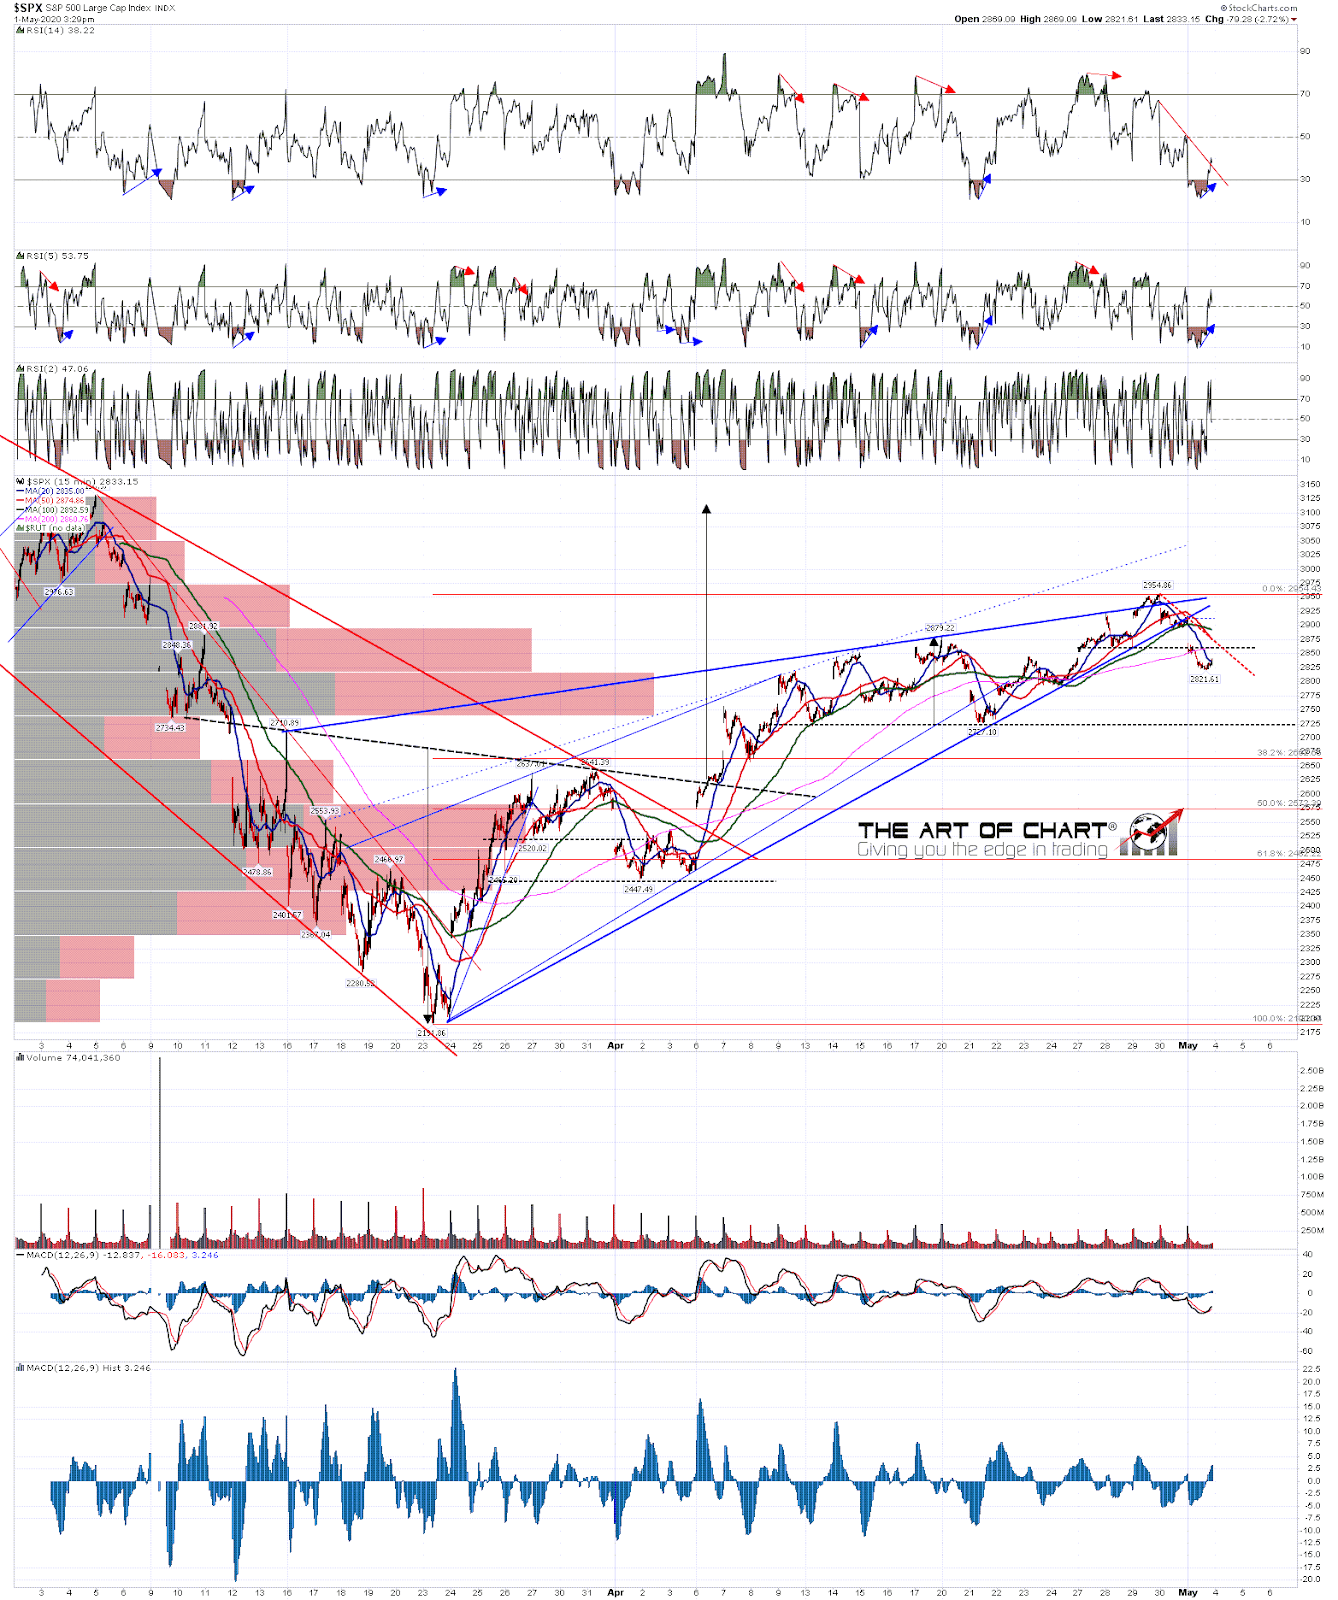
An hourly RSI 14 sell signal fixed after the high this week and has reached the possible near miss target. The hourly 50 MA was broken this morning and if we do see a rally back to the 2860 area on Monday, would add to the already impressive resistance there.
SPX 60min chart:
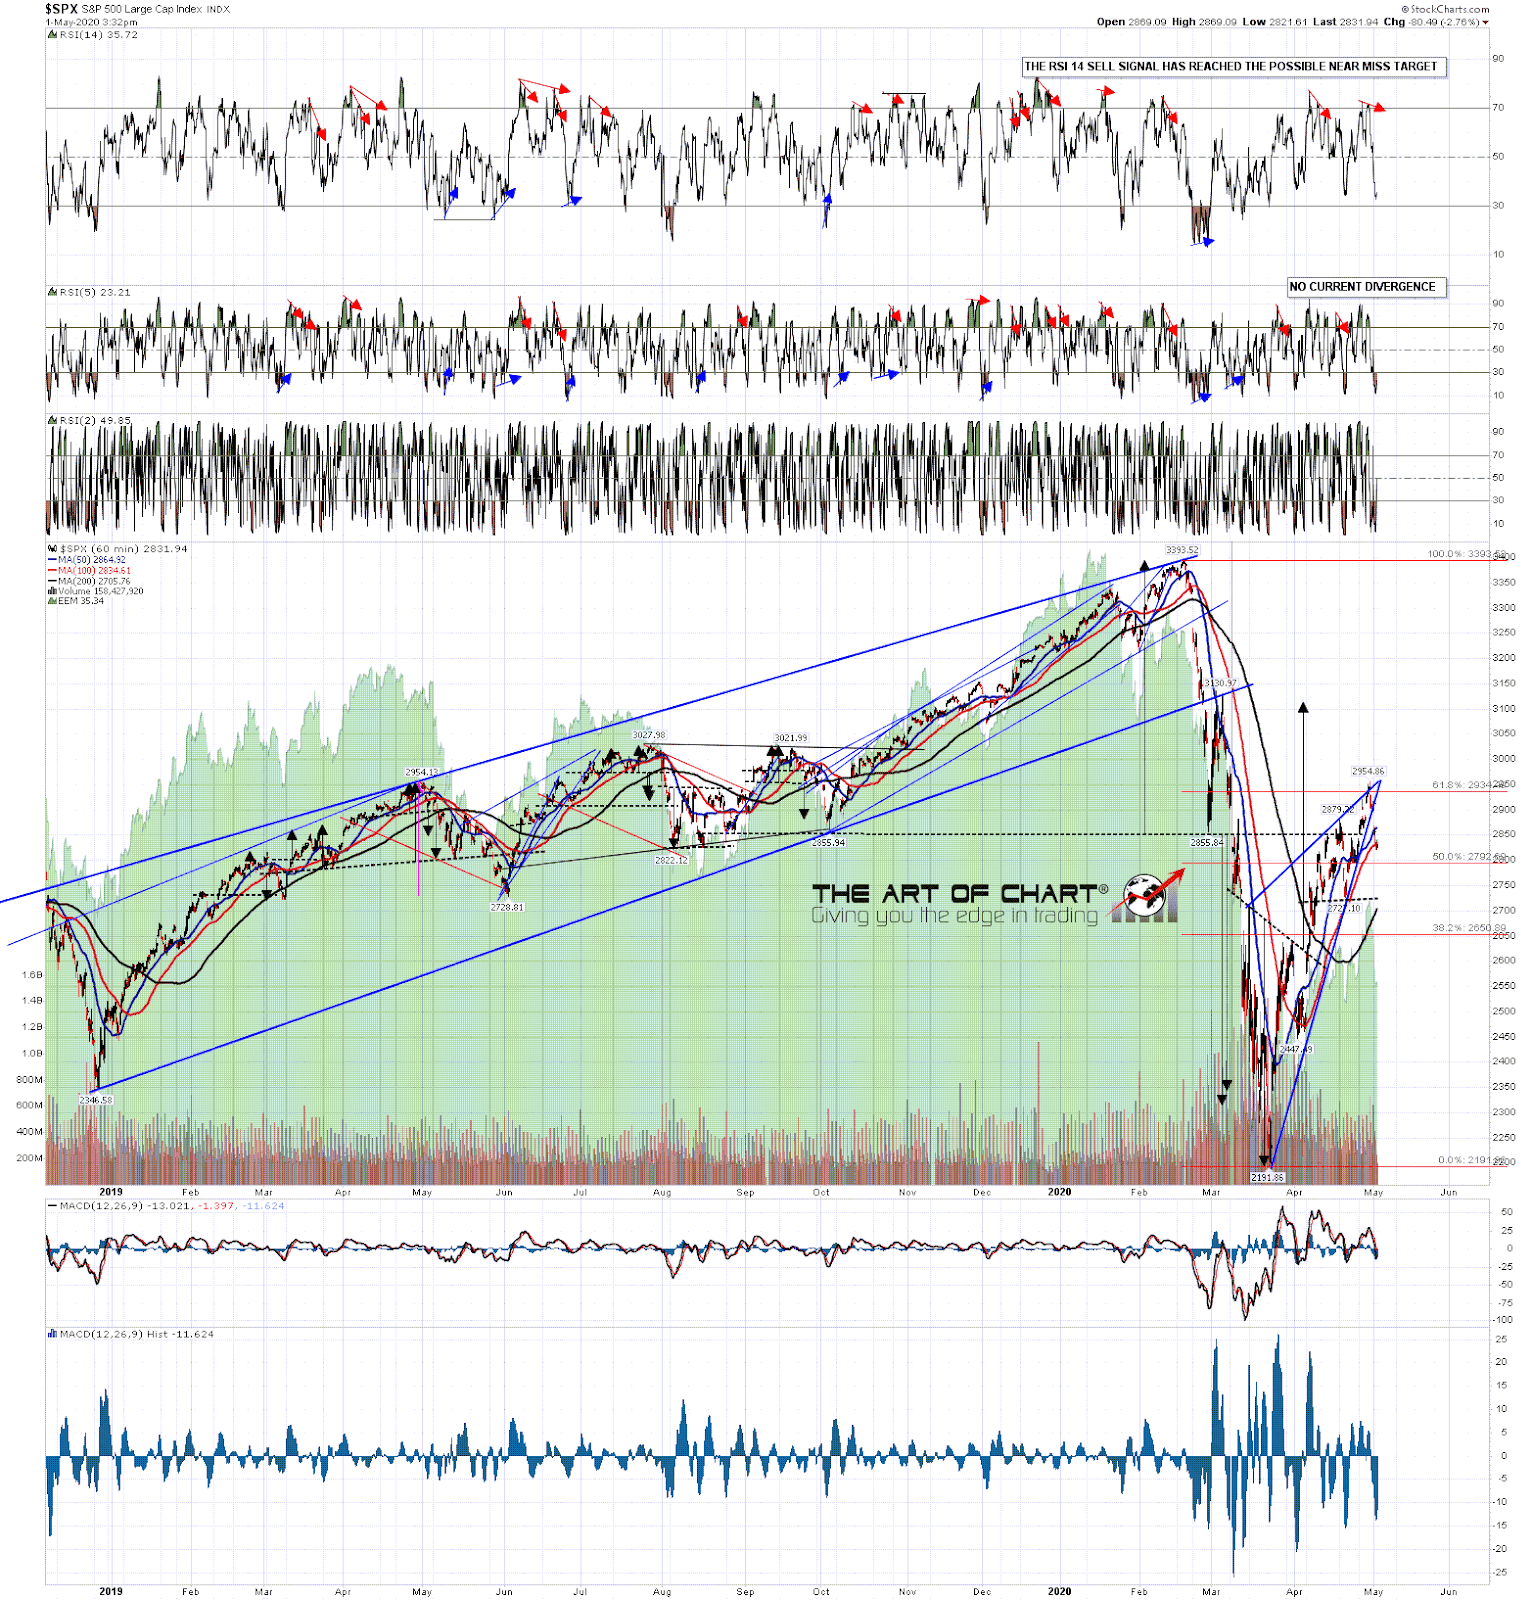
I’m concerned that the daily RSI 5 sell signal on SPX failed at the high on Wednesday, so that is no longer supporting this decline. I’d also note that the strong support levels at the daily middle band and the new monthly pivot are at 2791 and 2771 respectively, and both are important levels to watch. SPX daily chart:
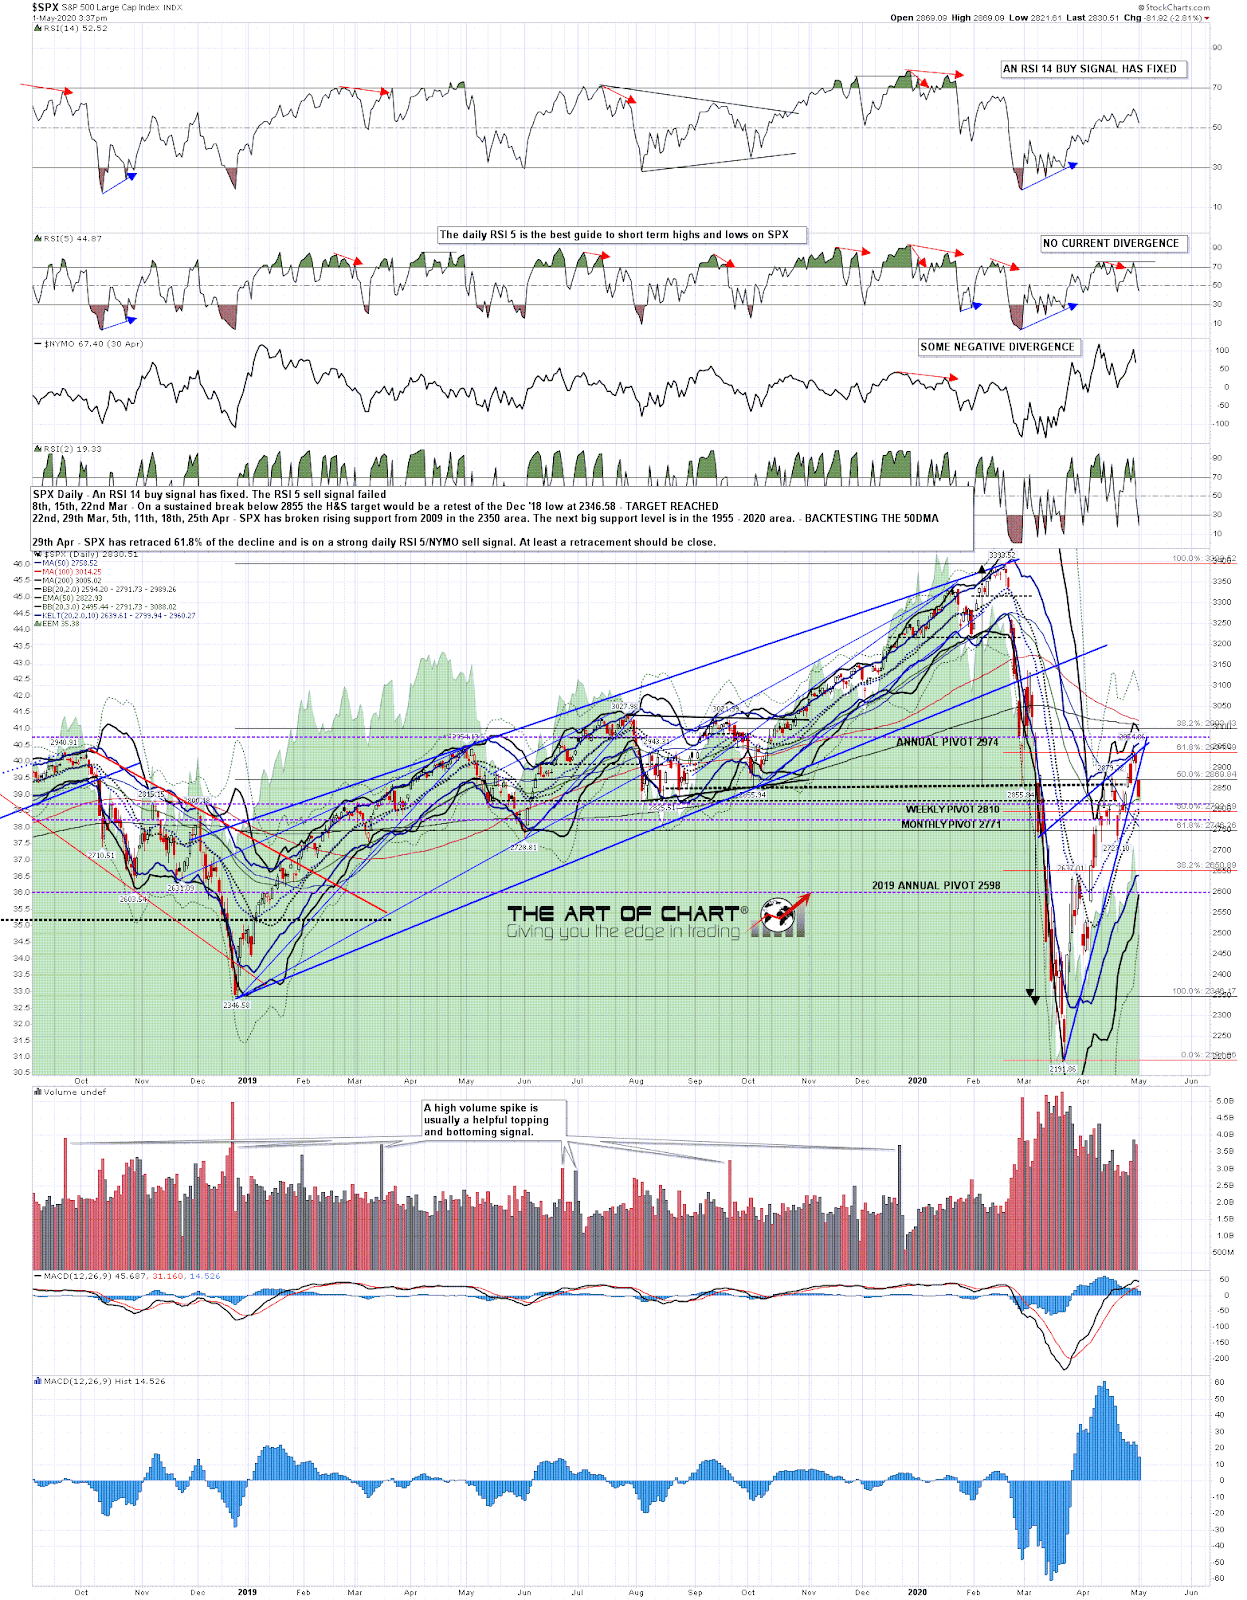
This is a wild market but the standard minimum levels I’d be looking for an a break of a rising wedge like the one shown on the 15min chart above would be at the 38.2% or 50% retracement levels in the 2662 and 2572 areas respectively. There’s some decent support below but particularly if the daily middle band can be broken and converted to resistance, these are the levels that I would be generally be looking for even in a retracement that then rejected into higher highs. If seen, the next serious inflection point area for SPX should be the 2550-2700 area.
Stan and I are doing our monthly free public Chart Chat at theartofchart.net on Sunday covering the usual wide range of equity indices, bond, forex and commodity markets. If you’d like to attend you can register for that on our May Free Webinars page. Be there or be unaware! Everyone have a great weekend. 🙂
 01st May 2020