Firstly my apology for the lack of an update last week. As I’ve mentioned, I’m negotiating my way through a difficult divorce at the moment, and some weeks are harder than others. On the harder weeks I struggle to get any posts done. As the weeks and months pass everything should be resolved and I can just move on and I’m really looking forward to that.
So what has happened since my last post? Well I noted wryly that I lost several twitter followers as soon as I published my last post, and I assume that was because I was looking for a support break and retracement on SPX, and that is exactly what we have seen. I think that the low we have just made is what I would call ‘the low before the high’, just a sort of stretching of recently unused muscles before a larger retracement gets going, and I’ll be looking at possible targets for that retracement in my next post.
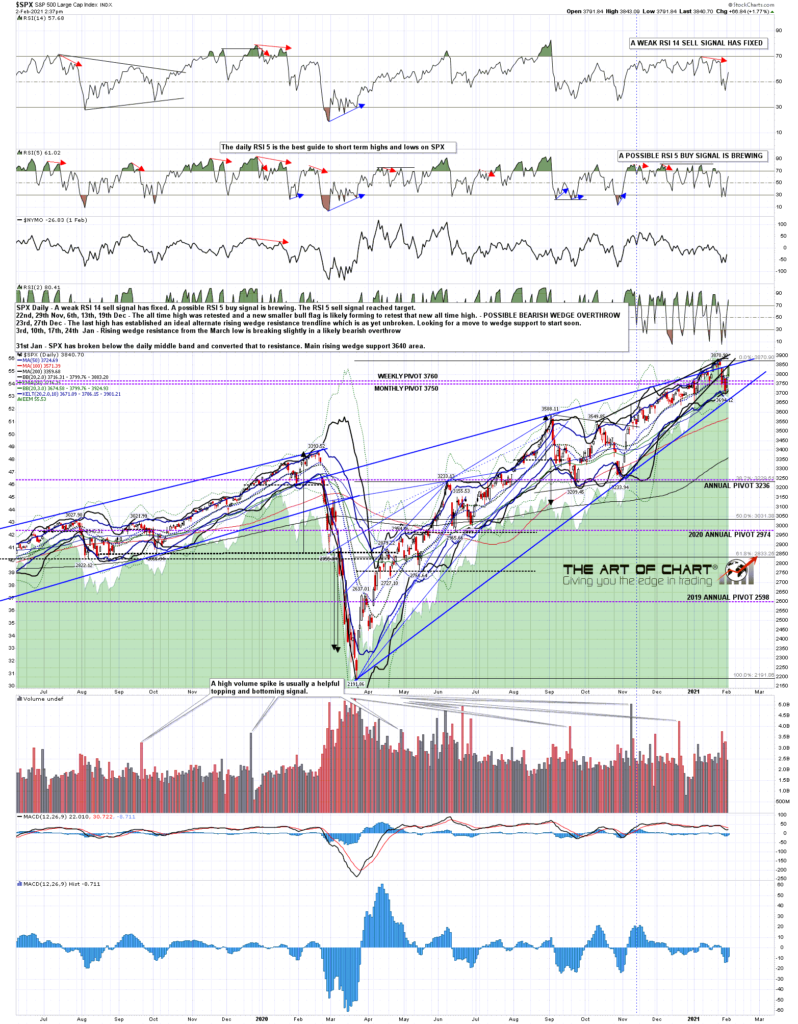
In the meantime SPX closed below the daily middle band for the first time since early November, then backtested it as resistance and made a lower low before breaking back above it today. I’m expecting a close above the daily middle band (currently 3795 SPX area) today and there is a strong setup here for a full retest of the all time high next. The daily RSI 5 sell signal in my last post made target, a weak daily RSI 14 sell signal has now also fixed and on the bull side, a daily RSI 5 buy signal should fix at the close today and may reach target.
SPX daily chart:
On the SPX hourly chart the rising wedge from the late October low has broken down and the next obvious trendline target is rising wedge support from the March low, currently in the 3650 area. We will likely retest the all time high before we see that tested, though I do have an alternate scenario where we see a lower high here and then a lower low before that high retest, and I’ll be looking at that on the next chart:
SPX 60min chart:
On the 15min chart below you can see the strong break of the rising wedge from the late October low and the modest retracement of that that was likely completed on Friday. A falling megaphone formed from the high that is a likely bull flag and that broke up at the open this morning with a minimum target at a retest of the all time high.
There is a possibility too though that a larger bull flag may be forming and SPX might break down into a lower low before that all time high retest. If so the ideal target for that lower low would be the red dotted trendline that I have drawn in, declining gently and currently in the 3675 area.
SPX 15min chart:

In the short term SPX has established two rising channels from the current retracement low at today’s high, and a 5min RSI 14 sell signal has fixed today. These tend to deliver and you can see six of these on the chart over the last two weeks and all of them made target. What I’m expecting to see here is a retracement over the next trading day or so that would likely break the smaller channel support and test the larger channel support, currently in the 3793 area but rising about 45 handles per day, so if we are going to see a retracement, I’d be looking for that low tomorrow lunchtime at the latest really. If that channel support trendline holds then the next obvious target would be the all time high retest, at which point I would be looking seriously for signs of the next short term high.
SPX 5min chart:

A couple of announcements today. The first is that we are offering a free week at theartofchart.net on our Vega Options service so if you are interested you should check that out here. The second is that we are doing our monthly public Chart Chat at 4pm EDT On Sunday so if you’d like to attend you can sign up for that directly here, or from our February Free Webinars page.
I’m planning my next post on Thursday but if tomorrow is interesting enough I might bring that forward.
 02nd Feb 2021