I remember a reader describing me a few years ago as an ‘if, then’ analyst, and that was a pretty decent description, as nothing is ever certain and markets move from one inflection point to the next, where there is another ‘if, then’ decision to be made.
I was talking in my last post about the possibility that SPX would break up into a high retest, and it did, so the H&S is no longer forming, and the setup on SPX is now a possible nested double top setup. I went though decades of charts on SPX a few years ago and calculated that some 70% of highs and lows on SPX were some kind of double top or bottom so that isn’t necessarily bullish so far.
In the short term a very decent quality rising wedge has formed from the last low at 4164, so I’m expecting that to break down and at least deliver a retracement. If we see a retracement back to the 4164 low, that is now double top support on the smaller of the two nested double top setups.
SPX 5min chart:

Looking at this inflection point, there are two obvious options on SPX.
The bearish option is that SPX breaks down here into a likely retest of the 4000 area, with the target on the larger of the two nested double top setups looking for a retest of the 3830-50 area if that full target was to be reached.
The bullish option is that SPX and NDX break up over this resistance area and the obvious target on SPX would be the wedge resistance trendline on the rising wedge from the March 2020 low that broke the rising support trendline at the recent lows. That trendline is now in the 4375-4400 area, so that is quite a distance higher. If that trendline is reached I would then treat that as a wedge expansion and redraw the wedge support trendline through the last low and the wedge would return to being unbroken.
The bearish setup for the retracement here is very nice and with the Fed likely to start tapering soon this seems a good time to correct, but at the end of the day price makes all decisions, we’ll see. If we are going with the bullish option we could see a reversal down here that went as low as the 4130-40 area and still then reject into that target area. We will see.
SPX 60min chart:
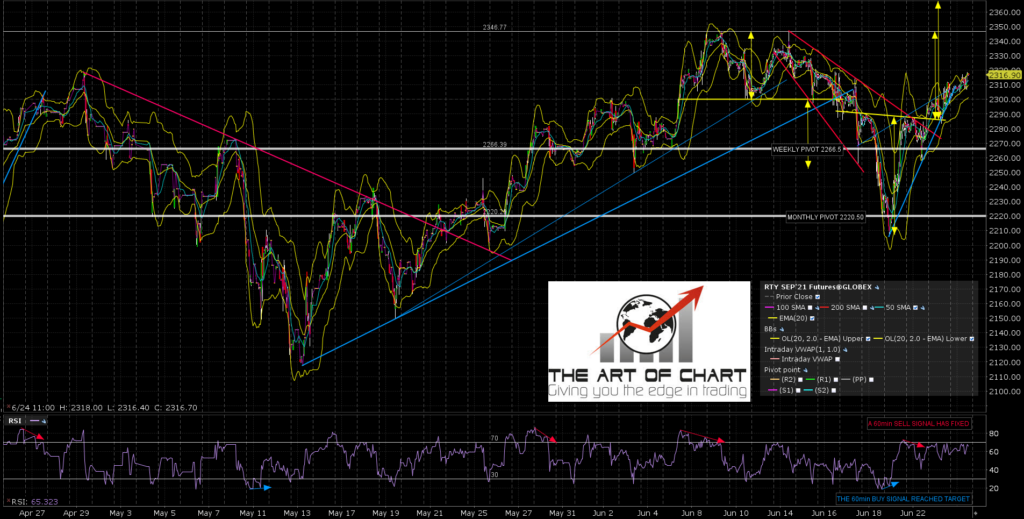
I mentioned in my last post that there was a possible IHS forming on RTY that I would be taking more seriously if SPX failed to reverse downwards this week. That is oversized but has now broken up with a minimum target, if the break up is sustained, at a retest of the June high, and is now getting close to that target.
RTY Sep 60min chart:
Since my last post an (also oversized but still valid) IHS has also formed on YM and broken up with a target at the late May/early June high and that too may make that target.
YM Sep 60min chart:

As I mentioned last week, this week is one of the most historically bearish weeks of the year on SPX, but has now been largely wasted. With last Friday being a notable exception, large moves on Fridays tend to be bullish. We are still however about to start the most bearish four months of the year on NDX. If we are going to see the decent retracement that is setting up here, this is still a good time time to do that. We’ll see how that goes.
Last Friday’s commodity webinar was delayed until Thursday 24th June, so we will now be doing a double bill of free public webinars at theartofchart.net tonight starting an hour after the close.
Those two webinars will be firstly the monthly Big Five and Key Sectors webinar covering AAPL, AMZN, FB, GOOG, NFLX, TSLA and eleven sector ETFs. If you’d like to attend you can register for that here. The second webinar, starting half an hour after the first, is the commodity trading webinar. As usual we will be looking at three promising trade setups and designing three options setups to trade those. You can register for that here, and the registration links and recordings for that and the other free webinars this month are also of course on our June Free Webinars page.
We also run an annual July 4th sale at theartofchart.net with an additional 20% off the already discounted price for annual memberships, giving effectively four free months on an annual membership until the sale ends. If you’re interested the sale page is here, and remember you need to enter the sale code JULY4SALE in the checkout process.
I may do another post tomorrow depending on what SPX does in the meantime.
 24th Jun 2021