I was saying in my post last Thursday that if support was found at the levels being tested then, the next target within the rising wedge would be wedge resistance in the 4500 area, and well, here we are.
Now we are back at the daily upper band, and testing a wedge resistance trendline that has already held several times. The chances are that SPX is making another high here, setting up a pattern that can take us lower again than the last decline, so that is what I’ll be looking at today.
In terms of the wedge itself, it is high quality, with an excellent resistance trendline that is unlikely to be broken significantly unless we are going to see a bearish overthrow, not uncommon at a significant high on wedges, or unless the wedge breaks up with a target in the 6800 area which sounds crazy, but really the market went through crazy without a backward glance a while back so it can’t be ruled out altogether.
SPX daily chart:
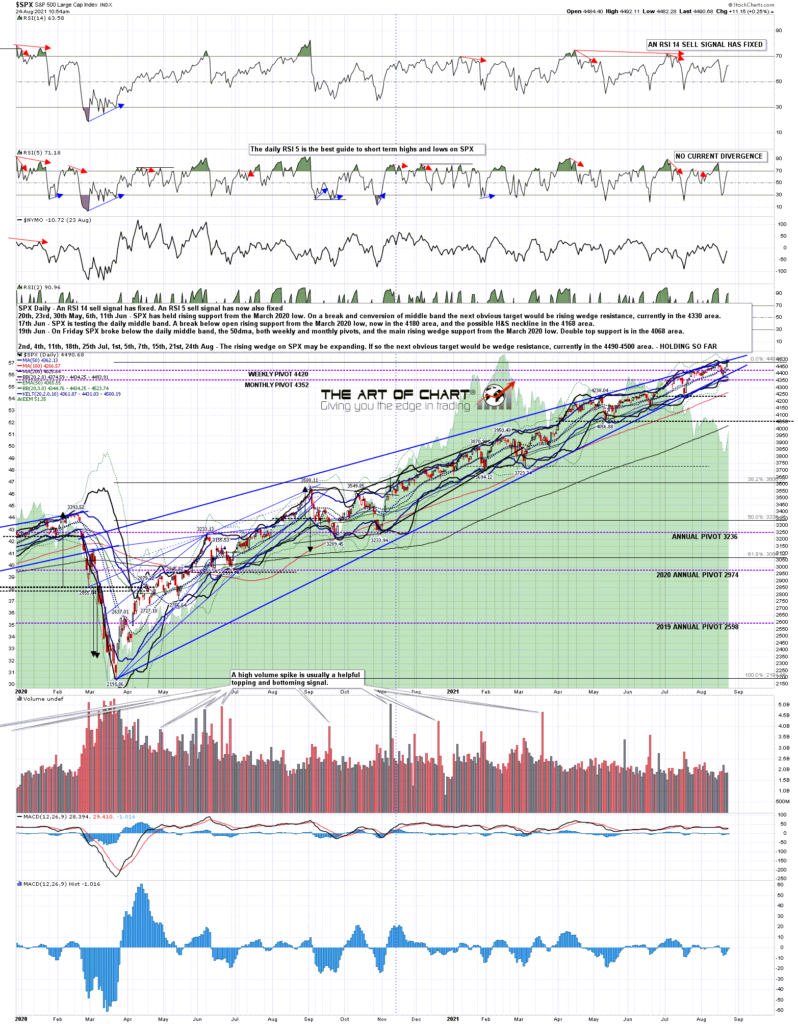
The main rising wedge support from the March 2020 low was tested at that low last week and it is that rising wedge resistance that is now being retested. No high quality RSI 5 sell signal forming yet on the hourly but there is now negative divergence here ……..
SPX 60min 20Mo chart:
……….. that you can see more easily on the ten month hourly chart.
The rising support from November 2020 was not hit at the last low, but the resistance trendline shown below is the one on the wedge from the March 2020 low.
SPX 60min 10Mo chart:

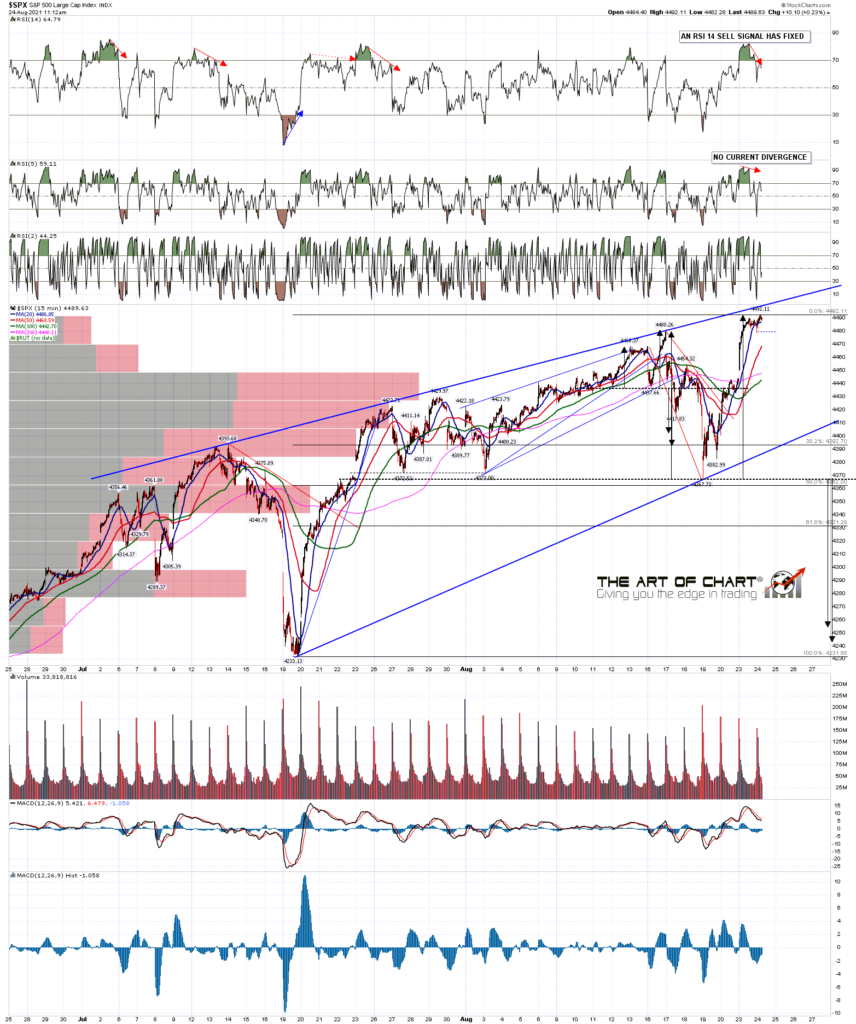
In terms of the topping setup here, there is now a very decent quality possible double top setup that on a sustained break below last week’s low at 4367 would look for a target in the 4245 to 4255 area. I think there is a very decent chance that setup delivers, though I think SPX might kick around here making this swing high for another two or three days first.
SPX 15min chart:
Just looking at the SPX weekly chart quickly, there are fixed sell signals on both RSI 14 and RSI 5 already of course, and I would note that the last time the weekly middle band was broken was ten months ago. That is the key level of support above that double top target, and the key level to be broken and converted in the event that my scenario for a backtest of the 3800 area that I outlined in my post on Friday 6th August is to have a chance of playing out. The weekly middle band is currently at 4296.
SPX weekly chart:

Overall I am really liking the odds of a decent retracement here, though it might be that would find support at the weekly middle band and return to the highs again. What I would say though is that the ideal time to do that would be into the end of October, and that is now only two months away.
An hour after the close on Thursday we are holding our monthly free public webinar on on the big five and key sectors at theartofchart.net and will looking at the usual six big tech stocks and eleven sector ETFs, many of which are looking particularly interesting here. If you’d like to attend you can register for that here, or on our August Free Webinars page.
 24th Aug 2021