The last high on SPX reached a few days ago was an impressive 5.54% above the 45dma, one of the highest readings in the last decade excluding the initial spike up from the March 2020 low, and slightly above the 5.4% reached at the early 2018 high. Coupled with the strong punch over the NDX weekly upper band then, that is a strong indicator that at least a short term high is being made, and I’m looking for a reversion to the mean move back to the 45dma, currently in the 4491 area.
SPX Daily vs 45dma chart:

The decline last week looks like a bull flag and, if so, that flag has likely broken up into what will likely be a full retest of the all time high at 4718.50. That full retest will set a possible daily RSI 14 sell signal brewing on SPX and, if also seen on NDX, IWM and INDU, would also set daily RSI 14 sell signals brewing on those.
SPX daily chart:
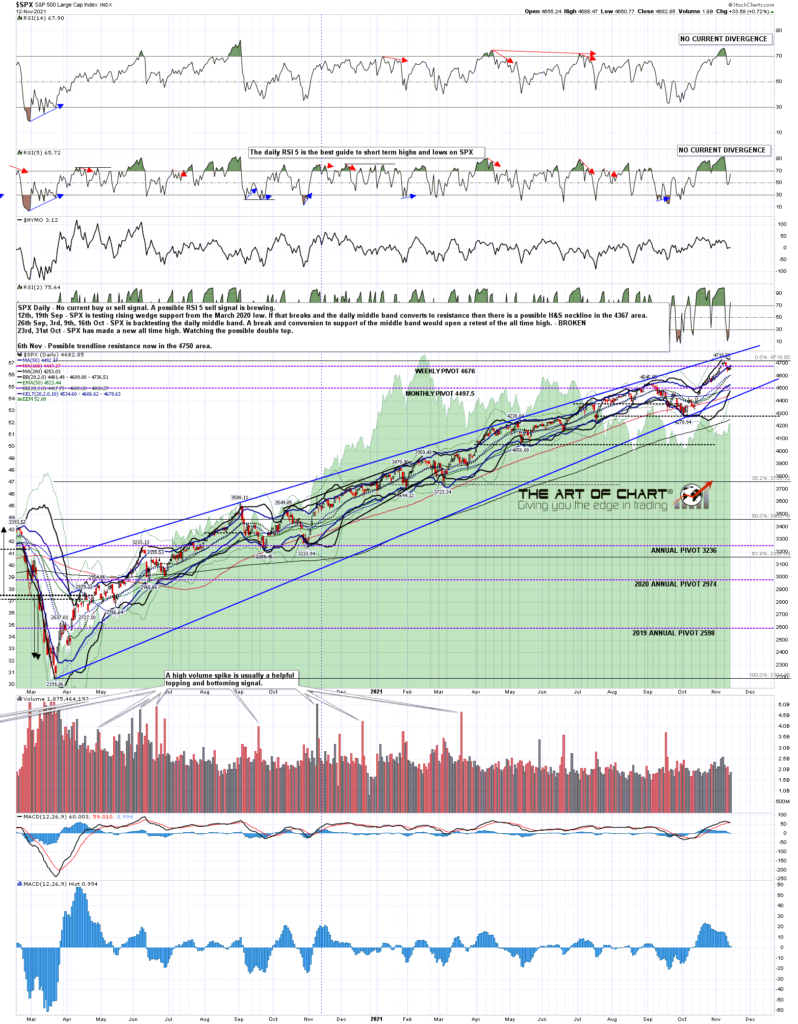
Could SPX go higher? Well I’d expect at least a marginal higher high, but if SPX goes much higher than that I’ll be watching possible trendline resistance now in the 4750 area.
SPX 60min chart:
On NDX the obvious resistance trendline has already been hit and slightly overthrown so I’m doubtful about much more than a high retest there.
NDX daily chart:
Could a larger high be forming here? Yes, and I’d refer back again to the backtest scenario that I was looking at in my post on Friday 6th August. This could be setting up for that backtest here and I’ll be watching the next retracement with great interest.
We ran our monthly public Chart Chat at theartofchart.net yesterday and if you missed that you can see that here, or on our November Free Webinars page. We look at the setup on equity indices there as well as the usual very wide range of other instruments. Particularly interesting looking setups on bonds, USD and silver if you are taking a look.
There is another thing I’d like to mention. I’m developing a new daytrading room with my long term daytrading collaborator Paul Buckles. That’s in late beta at the moment and I’m looking for a few of my longer term readers who daytrade to come and join us while we are making this ready for market. Obviously there would be no charge and we will be explaining our methods, which are mainly mathematical, as we do this. For any who then want to join when we launch the room there will be a reward in the form of a special discount for them. If you’re interested email me on springheeljack666 at gmail dot com.
 15th Nov 2021