In my last post I was looking at strong daily lower band rides on SPX that have the daily lower band ride as intraday resistance, rather than as support as would be the case on a standard daily lower band ride, and I used a previous instance from September as an example. Interestingly the path then taken by this band ride was similar to that last example, with the daily candle on Monday punching down through the 3sd lower band and then closing back above it, also generating a bullish daily high volume spike, then the daily candle on Tuesday being an inside day trading part of intraday back over the daily lower band, then the daily candle on Wednesday opening an closing back above the daily middle band.
So where does that leave SPX now?
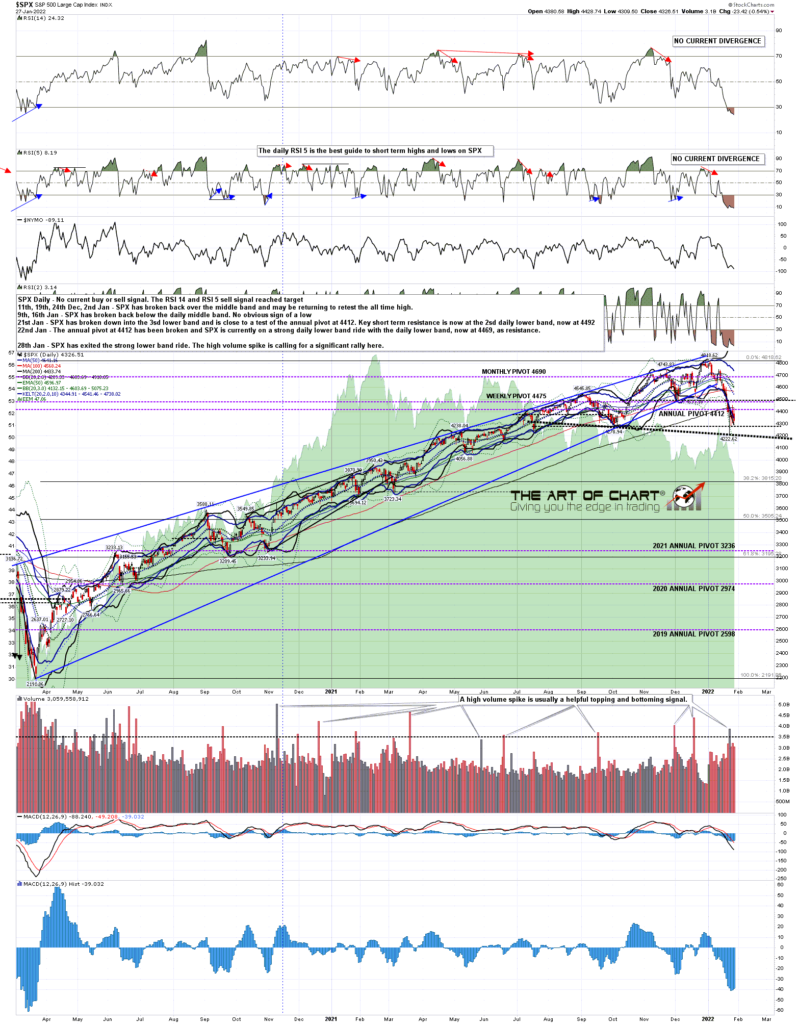
SPX daily BBs chart:

Ideally what we would then have seen would have been a rally strong enough to move the daily RSIs up so that a low retest would be on positive RSI divergence. That hasn’t happened as the rallies so far failed intraday and came back most of the way to the lows of the day.
There are also some reasons to think here that the next short term move may be that low retest, with of course the possibility that SPX might then continue down. What is the evidence for that?
SPX daily chart:
On the 15min chart below you can see that the rally on SPX so far has failed exactly at a declining resistance trendline on SPX. That declining resistance trendline comes off the right shoulder high on SPX that I showed on the SPX chart I used in my last post, but didn’t talk about because I didn’t think the H&S was of high quality. The establishment of this declining resistance trendline has confirmed that the H&S was valid, in which case of course I would expect main declining resistance to come off that right shoulder high.
Unless that declining resistance breaks, the next obvious move is a retest of the lows and possibly lower, but I don’t have an obvious lower trendline yet so it is hard to say exactly where that might be heading. The next low though would likely deliver a support trendline on a decline pattern.
SPX 15min chart:

There is more. On the NQ 60min chart I have a decent quality bear flag channel, and if that breaks down the obvious next target would be a retest of the low on NQ.
NQ Mar 60min chart:

There is also a decent quality bear flag wedge on YM so again if that breaks down the obvious target would be a retest of the low there.
RTY has already retested the low so there is no bear flag there.
YM Mar 60min chart:

In the short term I’m watching the bear flag support trendlines on NQ, currently in the 13900 area and YM, currently in the 33800 area. Breaks below would strongly suggest low retests. On the upside I’m watching that declining resistance trendline on SPX, currently in the 4410 area. A break above opens a possible test of the weekly and daily middle bands on SPX, currently in the 4567 and 4603 areas respectively, and main bigger picture resistance here.
It looks as though January will very likely close red now and, if so, that greatly increases the historical odds that 2022 will close red too. That’s called the January Barometer indicator, and I’m planning a weekend or Monday post next talking about that.
Everyone have a great weekend 🙂
 28th Jan 2022