Equity indices failed as I was expecting on Friday, but not necessarily for the reason that I was expecting, as it may have been primarily a news reaction to the alert from the US government that Russia is preparing to invade Ukraine within the next few days.
These came as unexpected news to many, possibly including the Russian government, which has requested that the US expand on this news further, and it may not be true of course, but either way there is a huge two-way news risk that will hang over the next few days and could deliver large moves in either direction.
How trustworthy are the Russians? Well in 1994, in return for Ukraine giving up the nuclear weapons it had inherited on the collapse of the USSR, Russia, the US and the UK signed the Helsinki Declaration guaranteeing Ukraine’s borders, so perhaps we should treat Russian denials here with some scepticism.
In the short term though SPX has broken back hard below the daily middle band, which closed Friday at 4483, and as long as that confirms today with another close below it the obvious next move would be a retest of the 2022 low at 4222.62.
SPX daily BBs chart:

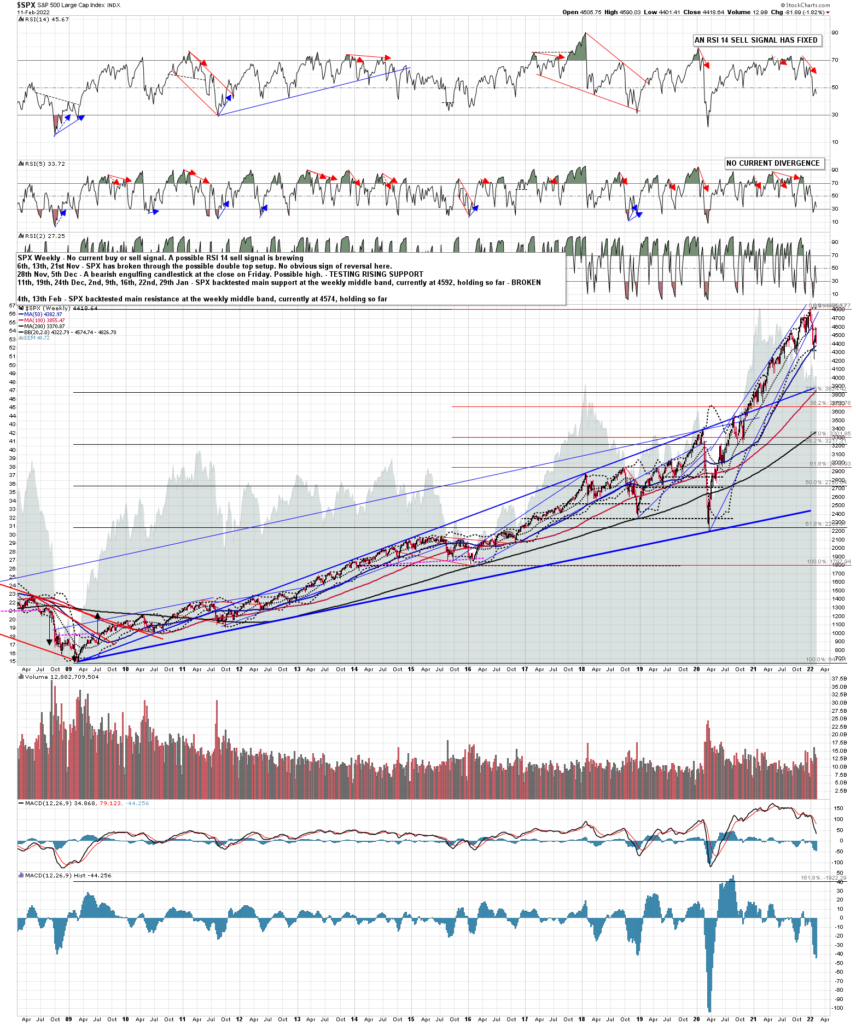
Main downtrend resistance at the weekly middle band, currently at 4575, has been tested and held as resistance at the high for both of the last two weekly candles. That’s a solid rejection, also looking for that SPX 2022 low retest.
SPX weekly chart:
On NDX the high last week was at a test of triple resistance at the 200dma at 15054, the monthly pivot at 15056, and the annual pivot at 15098. A very solid high at at formidable resistance and the next obvious target there is also a retest of the NDX 2022 low at 13724.85.
NDX daily chart:
In terms of downside targets the immediate targets on ES and SPX are the fixed double top targets in the 4300 area, then a retest of the 2022 low and then, if this is a large H&S forming on SPX as I have mentioned in previous posts, the H&S neckline in the 4200 area.
SPX daily chart:

On a hard break below 4200 I have a possible support trendline now in the 4100 SPX area and falling.
SPX 60min chart:
There is a lot of news risk this week and whether Russia invades or not the news could deliver a large move in either direction on equity indices, as well as delivering large moves in currency, bond and energy markets. This is very much a week to be wary.
We are doing a free public webinar at theartofchart.net an hour after the RTH close on Thursday on FAANG Stocks and Key Sector ETFs. If you’d like to attend you can register for that here or on our February Free Webinars page.
Our high end options service Paragon Options started the year strong with a $47,000 profit trading ES in January. We are looking at taking on up to ten new subscribers this month and if you’d like to sign up for a free trial you can do that here.
 14th Feb 2022