Putin revealed his thinking in a speech last week where he stated (incorrectly) that Ukraine had always been part of Russia historically, and has now followed through on that with what looks increasingly like a full occupation of Ukraine. If he meant what he said in that speech then Ukraine’s time as an independent country may well have ended for the time being, in what is also a harsh warning to any other ex USSR states bordering Russia that are thinking of seeking closer ties with the West, and looser ties with their scary imperial neighbour. Russia may have started to reconstruct the Soviet Union’s old empire, and a new Cold War may be starting here that would align the democratic west against the undemocratic East. That may of course have serious consequences on trade with China in due course.
In my post on Friday 6th August last year I was looking at a possible backtest scenario on SPX that could be setting up and I reviewed how that is looking on my first post this year, as I was thinking, and am still thinking, that backtest may well be delivered in the first few months of this year.
That backtest would be of a huge resistance trendline on SPX that broke at the end of 2020 / start of 2021, and is currently in the 3850 – 3900 area. The break over that trendline may have been a break up over a rising megaphone resistance trendline with a target in the mid 6000s on SPX , but if that is the case, to confirm that target, the trendline would need to be backtested, and hold into new all time highs on SPX.
Obviously the strength of this decline so far in 2022 has surprised most, so I’d like today to review what the decline so far is telling us, and to talk about the monthly SPX chart.
I’ve been talking about a backtest of the monthly middle band, now at 4047, which is now getting close, and not too far above the backtest of the broken trendline I have been looking at, now in the 3880 area.
If you look at the chart below you can see that the monthly middle band was tested or broken every year from 1998 – 2009, when this current very strong overall bull market started. Since then there have been three years with very strong bull moves when the monthly middle band wasn’t tested, those being in 2013, 2017 and 2021. In the years after those the middle band was backtested in 2014, and broken hard at the end of 2018. There have been strong breaks below the monthly middle band in 2011, 2015/6, 2018 and of course 2020. Backtests of the monthly middle band usually happen in bull markets in a normal year, even in this very strong bull market from 2009, particularly in a year after it has not been backtested, like 2021.
The second thing to say here is that the backtest of the monthly middle band and broken trendline resistance could deliver a 20% decline, putting SPX into a technical bear market, with NDX already crossing that line at the lows yesterday. That sounds alarming but in practical terms doesn’t mean much. The declines on SPX in 2011, 2015-6 and 2018 all delivered declines in the 15% to 22% range. The decline in 2011 was 21.5%, the decline in 2015-6 was 15.2%, and the decline in 2018 was 20.2%. Both of the 2011 and 2018 declines passed the 20% boundary for a technical bear market, and both ended almost immediately after doing so, so in effect all three were just strong corrections. The decline in 2020 went further, but was a crash rather than a bear market, like the one in 1987, but recovering far faster due to massive intervention by the Fed and US government.
There hasn’t been a real bear market since 2008-9, and while we could potentially see one of those here, the confirmation of that would have to be a sustained break below the 3800-4000 support range, and the conversion of that area to resistance. Until then it is just business as usual, and it is way too early to get excited about a real bear market happening here unless SPX makes a sustained break back below that rising support trendline in the 3880 area.
SPX monthly chart:

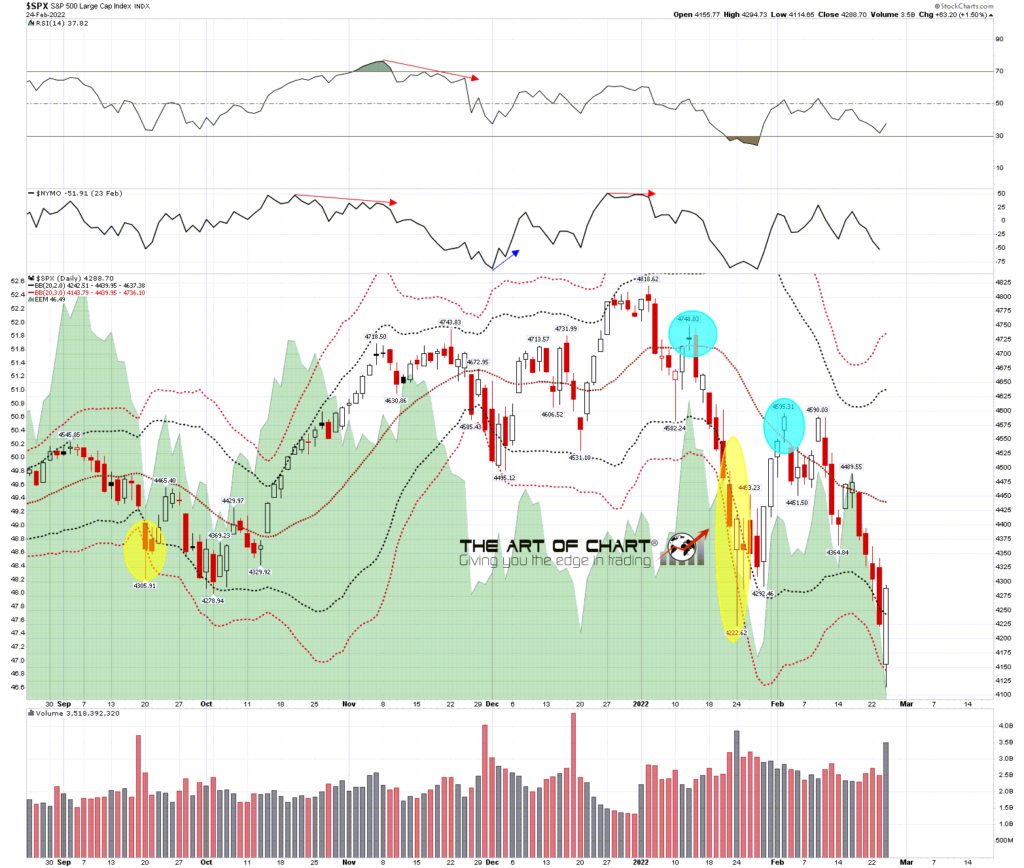
On the daily chart SPX broke significantly below the 3sd lower band at the open yesterday and, rallied strongly from there, as tends to be the case whenever that level is breached. Main short term resistance is at the daily middle band, now at 4439, and SPX could be starting a move here to backtest that.
SPX daily BBs chart:
On the hourly chart SPX broke briefly below the neckline on the H&S that has been forming, and broke the first candidate support trendline I had drawn in. If that wasn’t a bullish underthrow, which it probably wasn’t, then that opens a test of the possible falling channel support trendline, now in the 4030 area, and a decent match with the monthly middle band.
I would also note that the H&S target is in the 3600 area. I’m not expecting that target to be reached, but if there is a sustained break below the main support trendline in the 3880 area then that target will be on the table, with established support below in the 3500-3600 area.
SPX 60min chart:
On the NDX hourly chart the first support trendline I drew in was also broken briefly at the low yesterday. Again there is a possible falling channel support trendline below in the 12500 area.
There is a possible daily RSI 14 buy signal now brewing on NDX, and fixed on IWM, but nothing on SPX or INDU as yet.
NDX 60min chart:
On the IWM chart there is an existing, and good quality H&S target below in the 172 area, and not much here yet to suggest that target won’t be reached. short term though there is a decent double bottom setup here, and on a sustained break back above the last short term high at 209.05 the target for that would be in the 230 area.
IWM 60min chart:
We’ll be doing our free monthly chart chat at theartofchart.net on Sunday 6th March, but it hasn’t been set up yet. I’ll be posting the link to register for that in another post and on my twitter once that has been done.
Our high end options service Paragon Options started the year strong with a $47,000 profit trading ES in January. We are looking at taking on up to ten new subscribers this month and if you’d like to sign up for a free trial you can do that here.
Everyone have a great weekend. 🙂
 25th Feb 2022
Hey Jack, thanks, as always, for your posts. Is there any chance what is forming on the /es is a falling wedge pattern with the first low on 1/24 and the second yesterday on 2/24? If so, the profit target would probably a new ath. Thanks.
Possibly, but without an anchor for the support trendline that would be purely a speculation at this stage.
I do have a high quality option for a wedge support trendline, but that’s currently in the 4025 area.
Either way the odds are decent that some kind of bull flag is forming here.
Hi Jack,
On the /es 1 hour chart it looks like an inverted head & shoulders pattern, not perfect, with the left shoulder not quite coming up to the neckline. Do you see it that way?
thanks!