My apologies for the long wait between posts. I went out with some friends for the first time in two years on the first weekend in March and caught COVID, which has taken a while to clear. That wasn’t too bad and I’m clear now though I’m still feeling low on energy. Hopefully that will pass soon too.
I did post one of my premarket videos at theartofchart.net on my personal twitter on 16th March looking at the very large amount of bullish pressure underneath the market and wondering whether we would see a strong rally and we have since seen that strong rally, which has taken SPX back to main resistance at the weekly middle band. So what now?
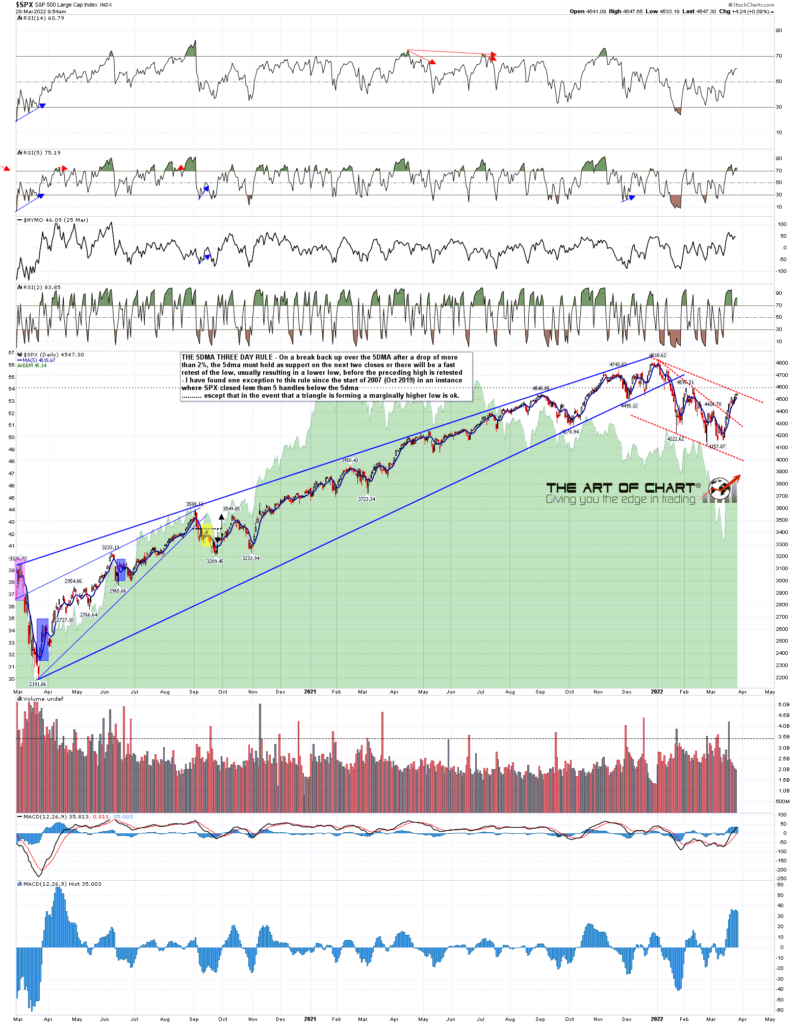
Well the first thing to mention again is that SPX is still on a 5dma Three Day Rule Signal, which is looking for a retest of the 2022 low at 4114.65 before a retest of the all time high at 4818.62. This is my strongest historical statistic that has delivered well over fifty times back to the start of 2007, so I am leaning strongly towards seeing that low retest. Is that a sure thing? No, every stat will fail sometime, and this could be that time, but the odds favor it delivering again.
SPX daily 5dma chart:
On the weekly chart the close last week was slightly above it but was in effect a close on resistance. A break and conversion of this level would open a possible all time high retest.
SPX weekly chart:

On the daily chart a possible RSI 5 sell signal is brewing, matching similar signals brewing on NDX and Dow, and with one already fixed on IWM. That is definitely what I would want to see here if we are to see a turn back down.
If SPX does turn down from this inflection point here I would note that the next inflection point would be at the SPX daily middle band, now at 3359. That would need to be re-broken and converted to open the low retest.
SPX daily chart:

On the SPX hourly chart I drew in an ideal falling channel resistance trendline a few days ago that might be a target if SPX should be forming a bull flag channel here. That may break later on today of course but the high so far today was a perfect touch of that channel resistance trendline, so a fail here would firmly establish that overall bull flag channel on SPX.
SPX 60min chart:
NDX is also showing a fixed hourly RSI 14 sell signal, as is Dow but not IWM. Again, there is significant pressure for a fail here on the hourly chart as well as the daily.
NDX 60min chart:
I’m leaning toward a rejection lower at this inflection point on indices, at least back into a daily middle band test. What is important if SPX breaks up instead?
You can see on my SPX daily and hourly charts that an H&S pattern formed and broken down on SPX with a target in the 3600 area. I was never expecting that to reach that target, but as and when that fails it would set a target back at the all time high retest. That fail would be on a break back over the right shoulder high at 4595.31, and if we see that directly from here, then that would be a significant bullish break suggesting that SPX may head to the all time high retest directly.
Now I am recovered from COVID, more or less, I’m planning to return to doing a couple of posts every week, so my next post should be on Wednesday or Thursday before the open.
 28th Mar 2022