SPX has been consolidating for a few days now, and generally speaking a consolidation like this leans bullish. I gave the ideal target for this rally at the weekly middle band and that remains the case in my view. That is now in the 4294 area.
SPX weekly chart:

In the short term SPX has been consolidating mainly above the current weekly pivot at 4120 and has tested the monthly pivot at 4083. No test of the daily middle band at 4036 yet, and we could see that, but the short term charts are favoring at least a retest of the current rally high first.
SPX daily chart:
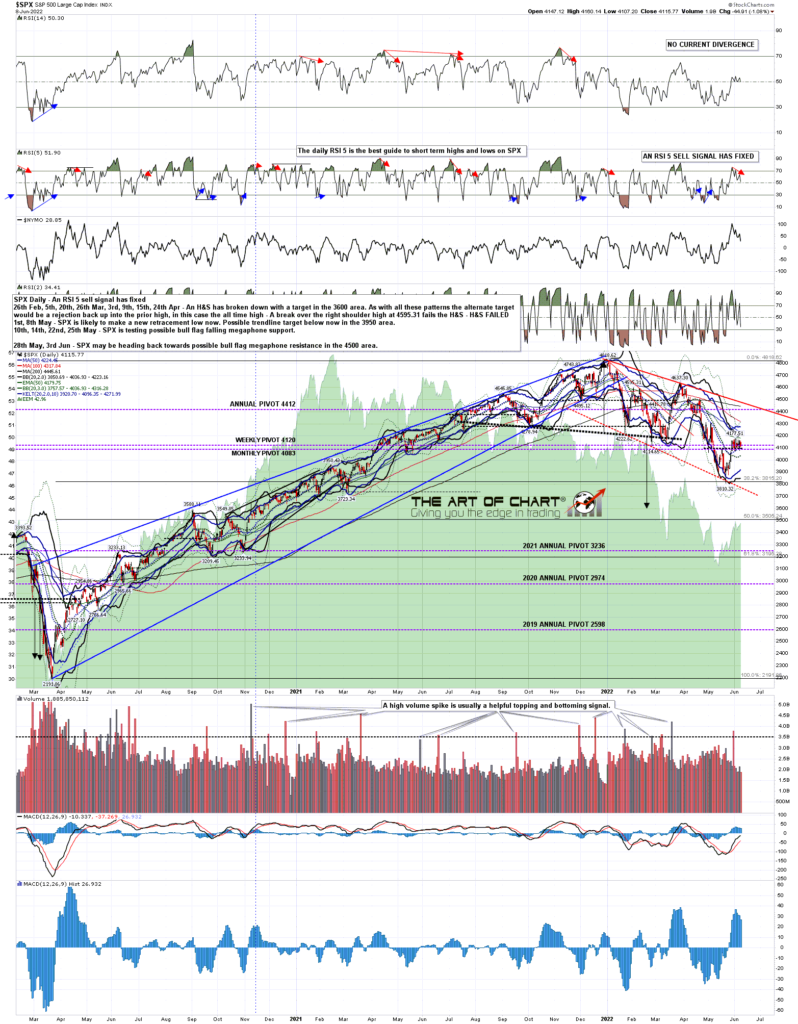
Looking at the short term charts a possible triangle is forming on SPX from the rally high. The next obvious target would be triangle support, currently in the 4082 area.
SPX 5min chart:

On NDX this looks like a bull flag falling wedge forming from the high. The next obvious target within the flag would be wedge support, currently in the 12390 area.
NDX 5min chart:

Dow is the most bullish looking in the short term though. This looks like a bullish triangle forming from the rally high and, if so, the low yesterday was a possible wave E low that would be seen directly before a break up. This may evolve into another kind of bull flag with a low below 32.5k, but it may just do the obvious thing and break up directly from here.
INDU 5min chart:

The historical stats for today and tomorrow lean bearish, and then lean bullish all of next week. If SPX is going to test the weekly middle band, that would be a good time to do that, and then most likely fail into a retest of the retracement low.
We did our monthly free Chart Chat webinar at theartofchart.net on Sunday, and if you’d like to see that the recording is posted here.
Stan has had COVID the last week but has been keeping up with our webinars so I believe that we are doing our monthly free Trading Commodities webinar at 5pm Eastern Time today, looking at trading opportunities and setups on commodities and designing three potential option trades from those , and if you’d like to attend you can register for that here, or on our June Free Webinars page. If that isn’t going ahead I’ll mention that on my twitter later today.
 09th Jun 2022