Yesterday’s bearish historical stats delivered hard and broke the bull flag setups that I posted in the morning. SPX is now testing the 4000 area and, if that breaks, the next target will likely be a retest of the retracement low at 3810.32.
I still like all the bull flags from the high here, but if SPX reaches the retracement low and continues down hard, there is an obvious target for that move. The H&S I have drawn on SPX from the high isn’t high quality, but it isn’t bad, and has a very obvious target in the 3400 area, which is a significant area because that would be a backtest of the pre-2000 crash all time high. In my view that would be the obvious target on a break below 3600.
SPX weekly chart:

On the SPX daily chart, the close yesterday was below main rally support at the daily middle band, now at 4041, and if we see a confirming close below again today, then that will be a significant signal that SPX may continue directly down towards the retracement low, and after yesterday’s breakdown, I do have a couple of high quality targets on the way there.
SPX daily chart:

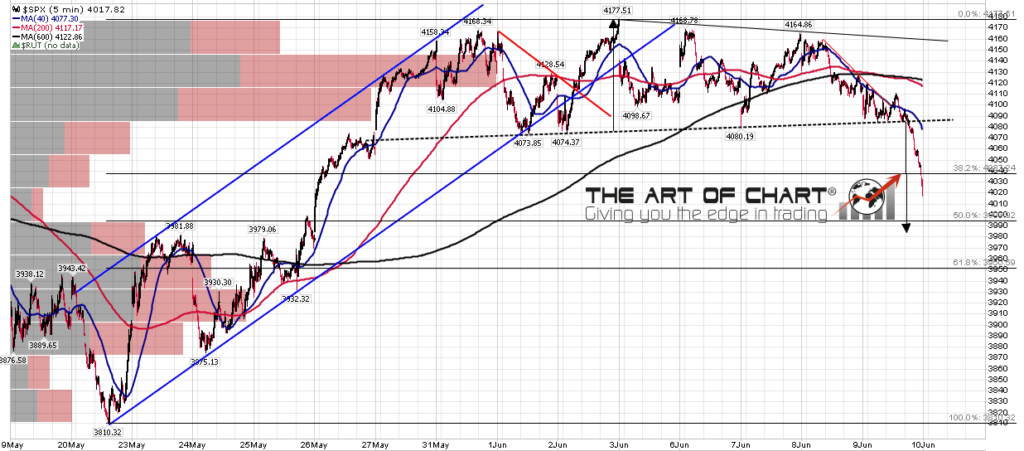
Now one of the three flags I showed yesterday was just a flag triangle, and triangle targets aren’t clear, but the other two had an alternate read as high quality H&S patterns, and those do have clear targets.
On the SPX H&S that broke down the target is in the 3980 area, and that’s not far below. That would also be the about the 50% retracement of the rally so far. If we were to see that tested today then a rejection to close back over the daily middle band, then that would be a cautiously bullish setup suggesting that we might then have finished an A and B wave for the rally, and be starting a C wave that might reach the weekly middle band in the 4300 area.
SPX 5min chart:
NDX has a more ambitious target for the H&S there, as that pattern has only just broken down, and the target is well below the 61.8% retracement level for the rally. That target is in the 11910 area and, if reached, NDX would likely follow through into a retest of the retracement low.
NDX 5min chart:

The historical stats for today lean bearish, and then lean bullish all of next week. If SPX is going to test the weekly middle band, that would be a good time to do that, and then most likely fail into a retest of the retracement low.
SPX may well fail directly from here though. Another close below the daily middle band would be bearish, and any significant move below the 61.8% level at 3950 would likely deliver a direct move back to the retracement low at 3810.32, where on the bullish scenario we might see the second low of a double bottom, and on the bearish scenarios we might fall through to one or both of the next decent support areas in the 3600 and 3400 area.
Everyone have a great weekend. 🙂
 10th Jun 2022