This is likely my only post this week, as I was wiped out by food poisoning on Sunday night, and while I’m feeling much recovered, my total food consumption so far this week is one hard boiled egg, a tortilla wrap, some houmous to go with the wrap and half a cookie, which is slim pickings. I’m cautiously considering possible menu items for today.
On to the markets though, and the H&S setup I was looking at yesterday morning in my premarket video at theartofchart.net I posted on my twitter failed and on the break over the right shoulder retested the rally high as expected (after the fail) and went a bit higher. So where does that leave SPX now?
Well I have some stats here. I have eight occasions so far since the start of the decade where SPX has been on a daily upper band ride, fallen away for at least two full days but not retraced as far as the lower band, then returned to a full retest of the upper band. Of the previous seven occasions a larger retracement started within a day from and only slightly above the retest new high four times, so the odds are decent that we will see a larger retracement start before Monday. Of the other three occasions one of those topped out for a few days before making a slightly higher high then starting the larger retracement, and only the last two continued higher directly.
SPX daily BBs chart:
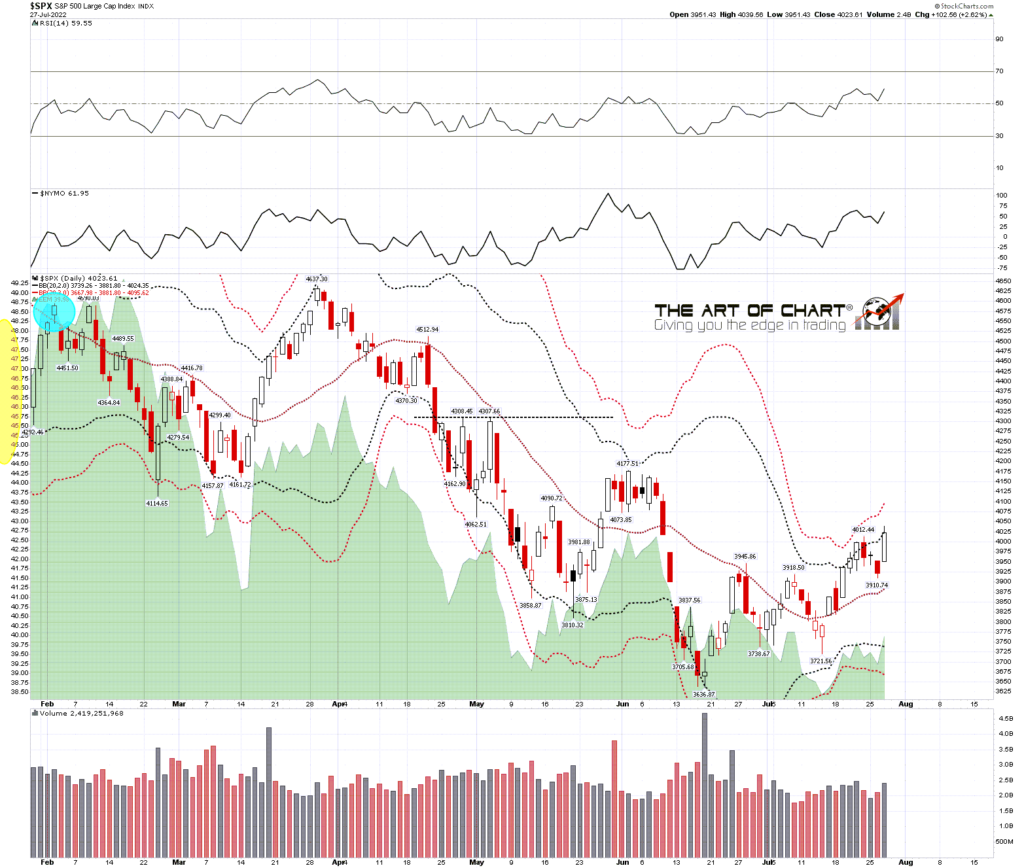
With the odds so far this decade favoring the downside here I would note that the high retest yesterday established negative divergence on the daily RSI 5s on the SPX, IWM and Dow charts, so all now have possible daily RSI 5 sell signals brewing. I would also note that there are still open hourly RSI 14 sell signals fixed on SPX and IWM.
SPX daily chart:
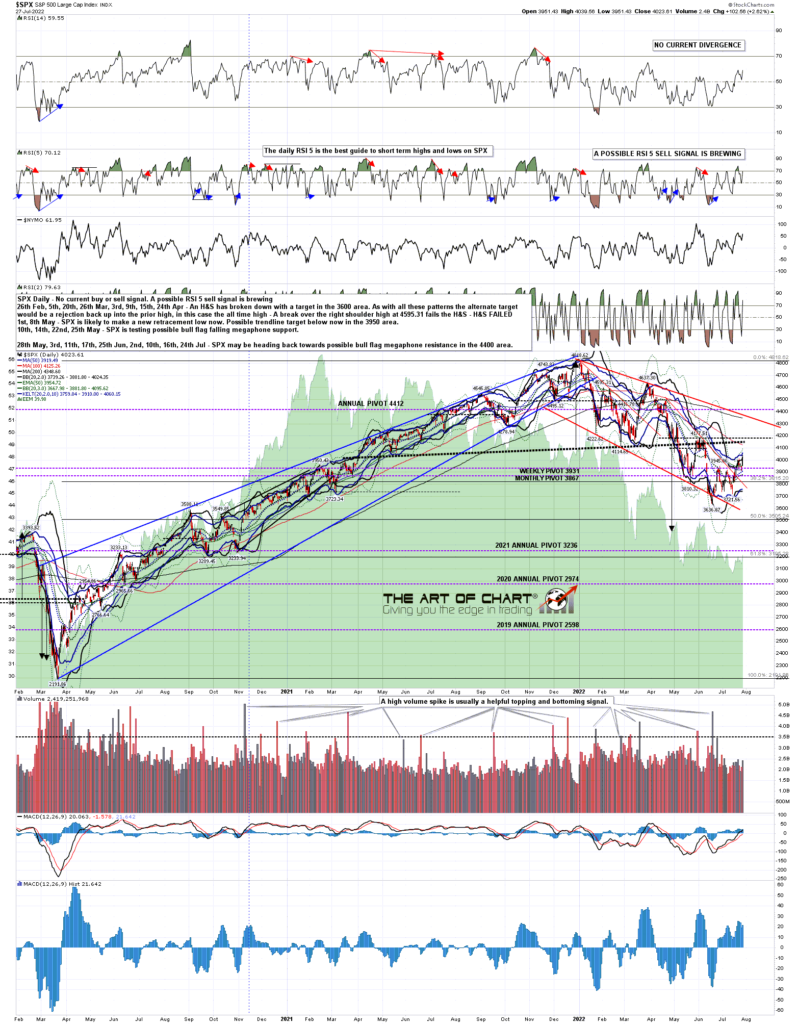
Looking at the SPX 15min chart the possible target trendline for this rally that I was looking at on 17th July is still a short distance above in the 4070 area, and in the event that SPX can hang around here for next week, that trendline will soon be approaching the main downtrend resistance at the weekly middle band, now in the 4110 area.
SPX 15min chart:

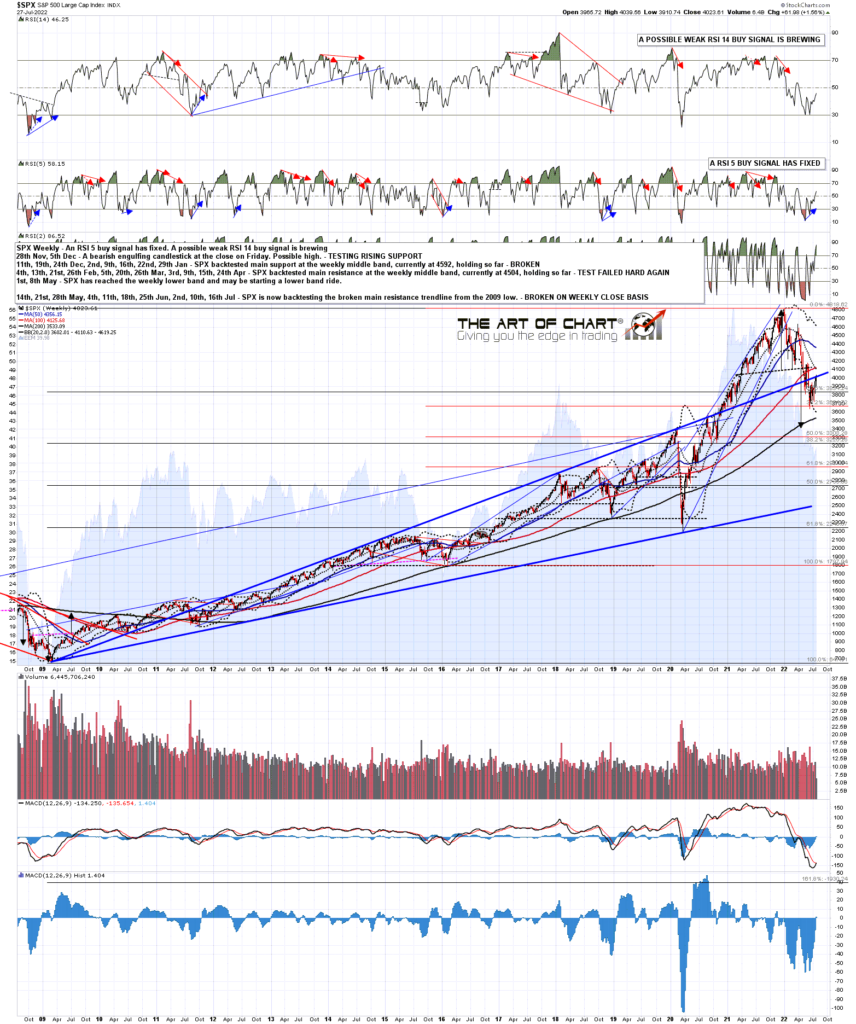
So far this year the SPX weekly middle band has held on a weekly close basis at every test this year, and if we are going to see a low retest before heading higher, then I’d be expecting that would likely hold again, though if we are not going to see a low retest, then I’d mention again that there is a possible IHS neckline in the 4190 area that could make a decent alternative bottoming pattern.
SPX weekly chart:
On any retracement I look for short term support mainly at the 50 hour MA, which was backtested and held, or lower at the daily middle band. Another level I keep an eye on though is the SPX 45dma, now at 3923, which I use for reversion to the mean calculations and that was also backtested very well, though one could argue that was a backtest of the more usually followed 50dma, now at 3920. Either way, if SPX continues higher from here, that will become significant uptrend support.
SPX daily 45dma chart:

Overall this rally still looks like a bear flag and the natural target for a bear flag is a low retest, so that is my lean for the next big move unless we see a clear closing break above the weekly middle band.
On the bigger picture the US indices are still within obvious bull flag setups from the all time highs though, and the natural targets for bull flags are retests of those highs. That doesn’t have to happen, but the rally this month is suggesting that it might.
On the even bigger picture though, I’d note that may well be a bearish retest that would set up double tops for larger declines, and that would be my primary scenario if seen.
In the shorter term the historical stats are essentially neutral for the next five trading days through next Wednesday with a slightly bullish lean Thursday and Friday. There is often a significant bearish lean at the end of a month and a bullish lean at the start of a month but that isn’t the case this time so both Friday and Monday are neutral.
If you’re wondering where I get these daily historical stats from, I get those from the Stock Trader’s Almanac 2022 by Jeffrey A Hirsch. I’ve been getting one at the start of every year for many years now and they are available from Amazon in the US and elsewhere.
Everyone have a great weekend. 🙂
 28th Jul 2022