I was talking on Friday about how every so often we see market moves that make no sense, but are technically sound, and go ahead and happen despite making no sense. I was calling these grey swans and as it happens there was a very good example of this that day.
On my daily 45dma chart at the intraday high SPX reached a level 9.1% above the 45dma, higher than both of the highs made after the 2020 low at 8.7% and 8.4%. That was something I didn’t expect to see, but here we are.
SPX daily 45dma chart:

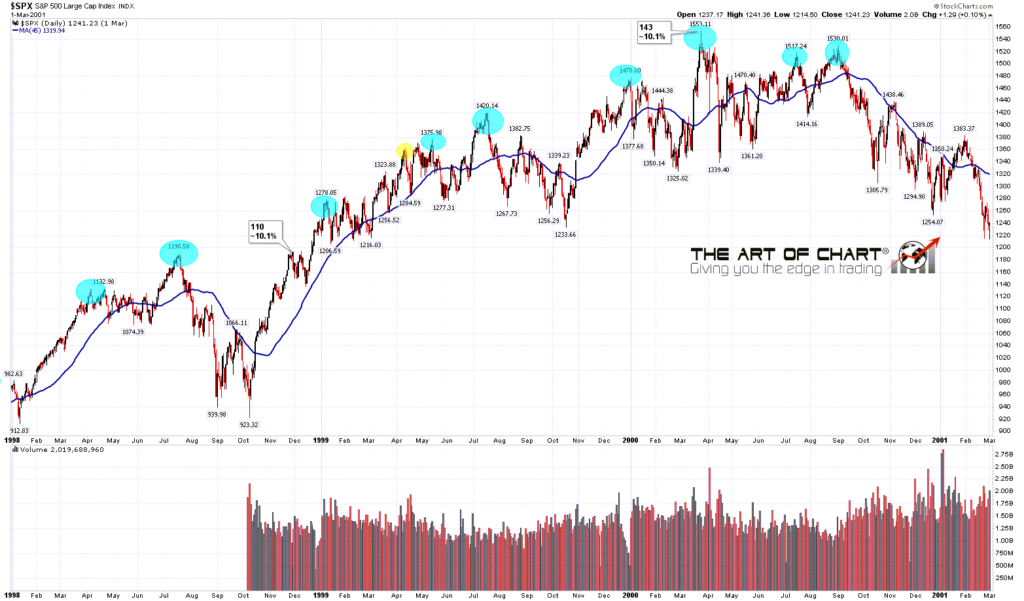
So how unlikely was this reading of 9.1% above the 45dma on Friday? I had a look through my SPX charts back to 2000, and the reading on Friday was the highest so far this millennium, but when I looked back a little further I did find two higher examples in the late stages of the tech bubble 1998-2000.
The first example was where I expected to perhaps find it, and that was in the sharp move up from the low in 1998, that reached a high at 10.1%, as did the final spike at the bubble high in 2000. Those two are the only readings I found above 9.1% in the last twenty five years.
If we were to see that level matched here, then SPX might just be able to reach the 4325 area on this push, and that might then deliver a test of declining and possible bull flag resistance in that area.
SPX daily 45dma 1998-2000 chart:
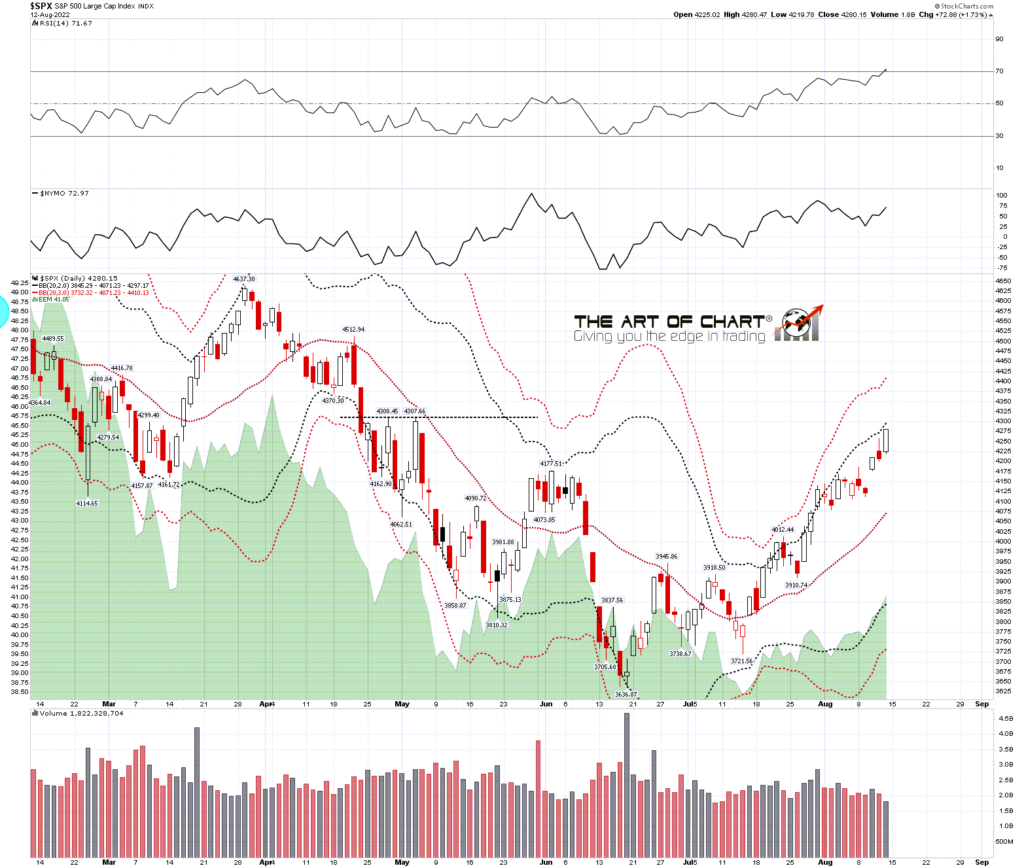
On the SPX daily chart there was a fixed RSI 5 sell signal on Friday morning, as well as similar signals brewing on NDX, IWM and Dow, but the SPX signal failed on the latest push up, and divergence was lost on Dow. That still leaves possible daily RSI 5 sell signals brewing on NDX and IWM, but there is now a lot less bearish divergence than there was on Friday morning.
SPX daily chart:

In terms of the SPX daily BBs the upper band is now in the 4300 area and a move to the 4320-30 area is potentially in range.
SPX daily BBs chart:
On the 15min chart the bear flag setup is now looking somewhat ragged, and I’m increasingly doubtful about it being a bear flag, but there is still a very decent looking rising wedge from the first higher low at 3721.56, and if that is to continue to form then the next obvious target within the wedge would be wedge support, currently in the 4180 area. If we see that retracement and wedge support holds, wedge resistance would then likely be in the right area for a possible test of the 4320-30 area.
SPX 15min chart:

We could just see a retracement start here of course, but if so, the the setup would still be improved by a retracement lasting a day or two and then a retest to set up the daily RSI 5 negative divergence again on SPX and Dow. We’ll see.
In terms of the historical stats I’d note that the first three days of this week all lean significantly bullish, at 61.9% bullish today and Tuesday and 71.4% bullish on Wednesday.
We are doing our monthly free public ‘Trading Commodities – Setups And Approaches’ webinar at theartofchart.net at 5pm EDT next Thursday 18th August. As usual we will be looking at three actionable trades using options. If you’d like to attend you can register for that here or on our August Free Webinars page.
My next post will likely be on Thursday or Friday before the open.
 15th Aug 2022