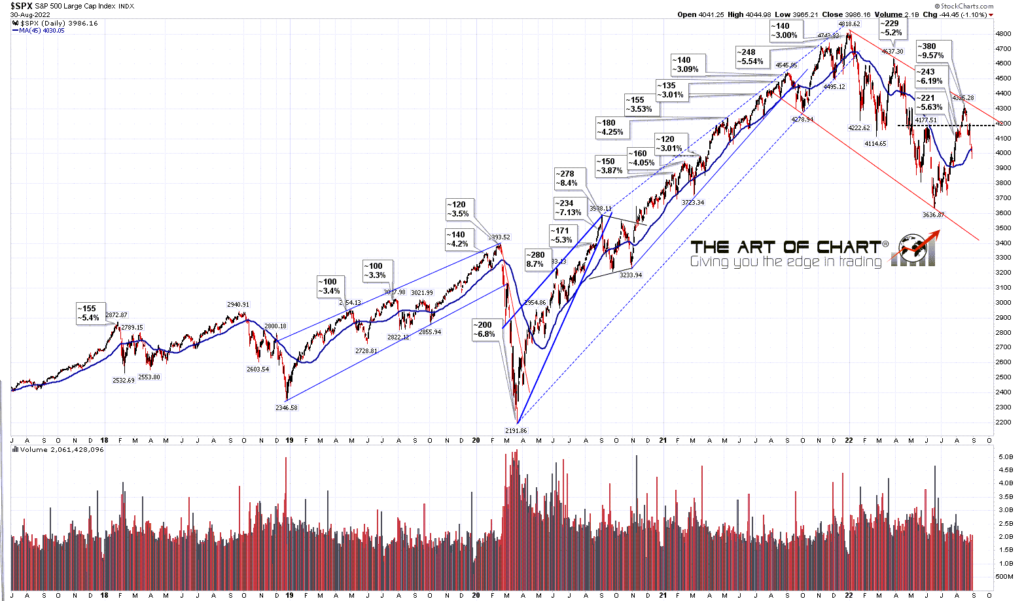
In my post on Friday I was looking for a fail at the backtest of the 4200 SPX area, and a break down from the H&S patterns forming on the US equity indices and we saw that fail and all the H&S patterns broke down. None of those have yet made target.
SPX has broken back below the 45dma, now at 4030.05, so the reversion to the mean move has been completed and I won’t be posting this chart again for a while.
SPX daily 45dma chart:
SPX has tested the daily lower band, now at 4000, on each of the last two days, so has started a possible daily lower band ride. If that is to continue then that will need a test again today. The 3sd lower band is at 3913 which now puts the H&S target in the 3910 area in range.
SPX daily BBs chart:

Possible RSI 14 and RSI 5 buy signals are brewing here on the hourly chart on SPX and most of the other US indices, and everything looks short term oversold, so we could see a rally attempt here. If so the first obvious resistance is at the 50 hour MA, currently at 4040.
SPX 60min chart:
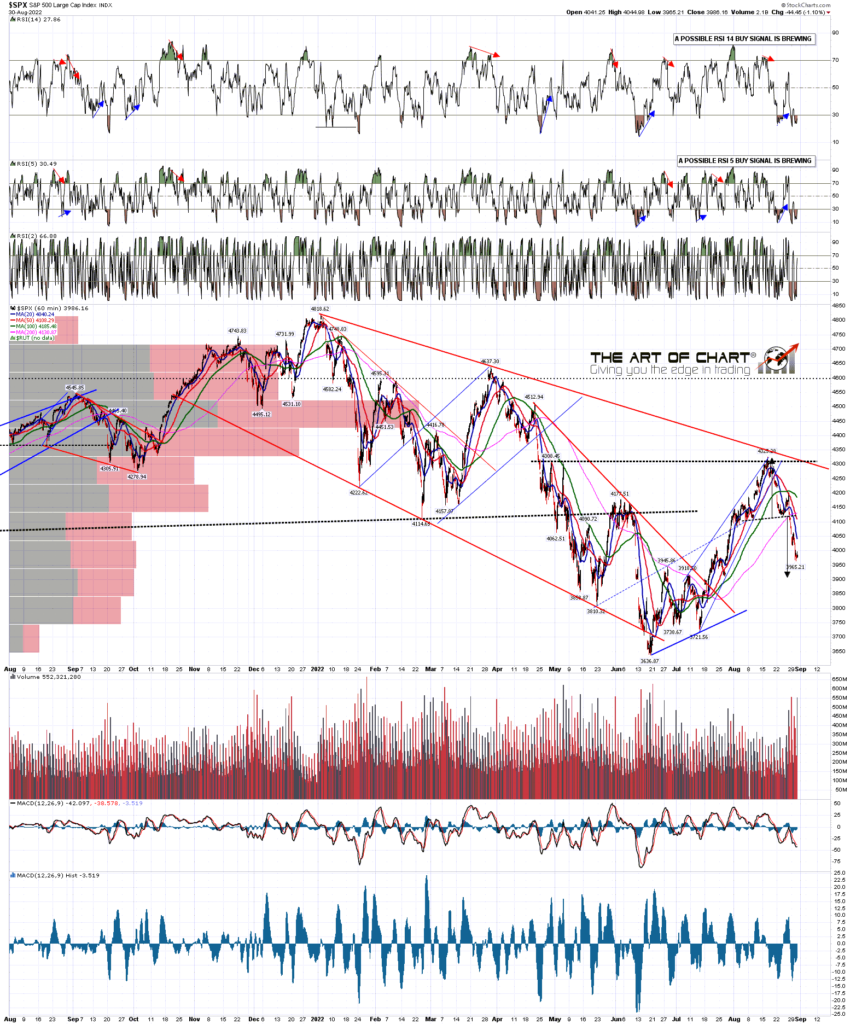
The H&S on SPX broke down with a target in the 3910 area, and I’m not seeing anything to suggest that target won’t be reached, but again there is positive divergence on the 15min chart with a fixed RSI 14 buy signal suggesting a rally attempt here.
SPX 15min chart:

On NDX, which has broken down with a target in the 11940 area, I was a bit concerned when I found a possible bull flag channel yesterday morning, but that broke down intraday yesterday so that potentially bullish setup is gone. NDX still looks like it may need a rally though.
NDX 15min chart:
Normally at the end of the month the last day of the month leans bearish and the first day of the month leans bullish. That’s not the case at the end of August though, with the last day of the month leaning 61.9% bullish and Thursday and Friday this week leaning mildly bearish. I am definitely wondering about a possible rally attempt today so we’ll see how that goes.
My next post should be on Friday before the open.
 31st Aug 2022