I was saying on Wednesday that the decent looking bullish setup was still there, but in the light of the Fed Chairman’s candid comments about future policy over the last few days a significant drive higher was looking improbable. I was looking for a test of weekly pivot at 4007 and then a fail there if we were going to see the bull scenario fail. SPX made it back to 4017 and failed hard, so the bull scenario, while not quite entirely dead, is now looking increasingly unlikely.
On the weekly chart, the bear scenario looks for a break back below the 50 week MA at 3990 and the weekly middle band at 3969. A rally today is likely, but for a clear move onto the bear scenario here I’d like to see a weekly close today below the weekly middle band at 3969, and lower lows next week. If we see that then the obvious target would be the 200 week MA, currently at 3726, and the key support level for SPX. A break and conversion of that level would open potentially much lower targets.
SPX weekly chart:

On the daily chart the RSI 5 buy signal reached the possible near miss target so I’m now disregarding that.
SPX daily chart:

So where is the short term support that is keeping the bull scenario breathing for the moment?
Well the first level is the broken declining resistance that has already been backtested as support, and that was being tested again at the low yesterday. A sustained break below 3900 should eliminate that as a support level.
SPX 60min chart:
The other level I was watching before the RTH open today was the bull flag channel support on SPX, but that has now broken, which leaves the bullish pattern scenario from Monday now hanging by a very thin thread. If this flag has in fact broken down, then the pattern target for that break is in the 3600 area.
SPX 15min chart:

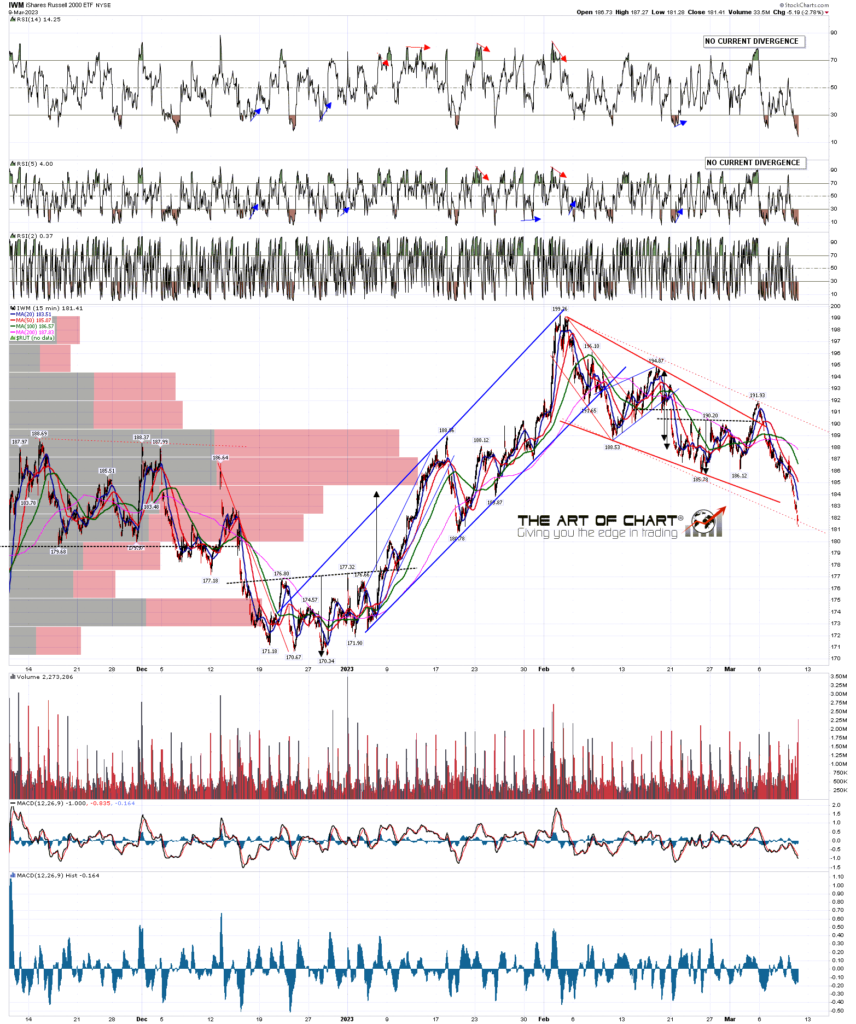
The other bull flag that has broken down is on IWM, which broke yesterday. That just leaves the flag setup on NDX with support currently at 11700, though with the SPX and IWM flags already broken I’m already almost entirely disregarding that.
IWM 15min chart:
In practical terms the bullish pattern setup has already failed and the downside scenario is now the likely one with a target at the 200 week MA now at 3726 and possible support there. A break and conversion of that level opens up further downside targets.
In the short term I’m thinking we might see a retracement to backtest the weekly middle band at 3969 on SPX to see whether it holds as resistance. If SPX closes below that today then that further strengthens the bear scenario here.
On Sunday this week we are doing our monthly free public Chart Chat at theartofchart.net, and if you’d like to see that you can register for that here, or on our March Free Webinars Page.
If you are enjoying my analysis and would like to see it every day at theartofchart.net, which I co-founded in 2015, you can register for a 30 day free trial here. It is included in the Daily Video Service, which in turn is included in the Triple Play Service.
 10th Mar 2023