I had been reading on and off for a month or so that ChatGPT had been forecasting a market crash on the Ides of March this year, and so was watching that with very mild interest yesterday to see whether this latest claimant to the Nostradamus throne might have any luck, but the day passed without a crash as expected. Predicting apocalypse is a famously tricky endeavour. Better luck next time I guess.

I was remarking though in my premarket video yesterday at theartofchart.net that for a day where everyone seemed to be leaning bearish, there were some surprisingly nice looking bullish reversal setups. One of those was the possible double bottom on SPX, which has now broken up with a target in the 4025-4040 range and backtested broken double bottom resistance this morning.
SPX 15min chart:
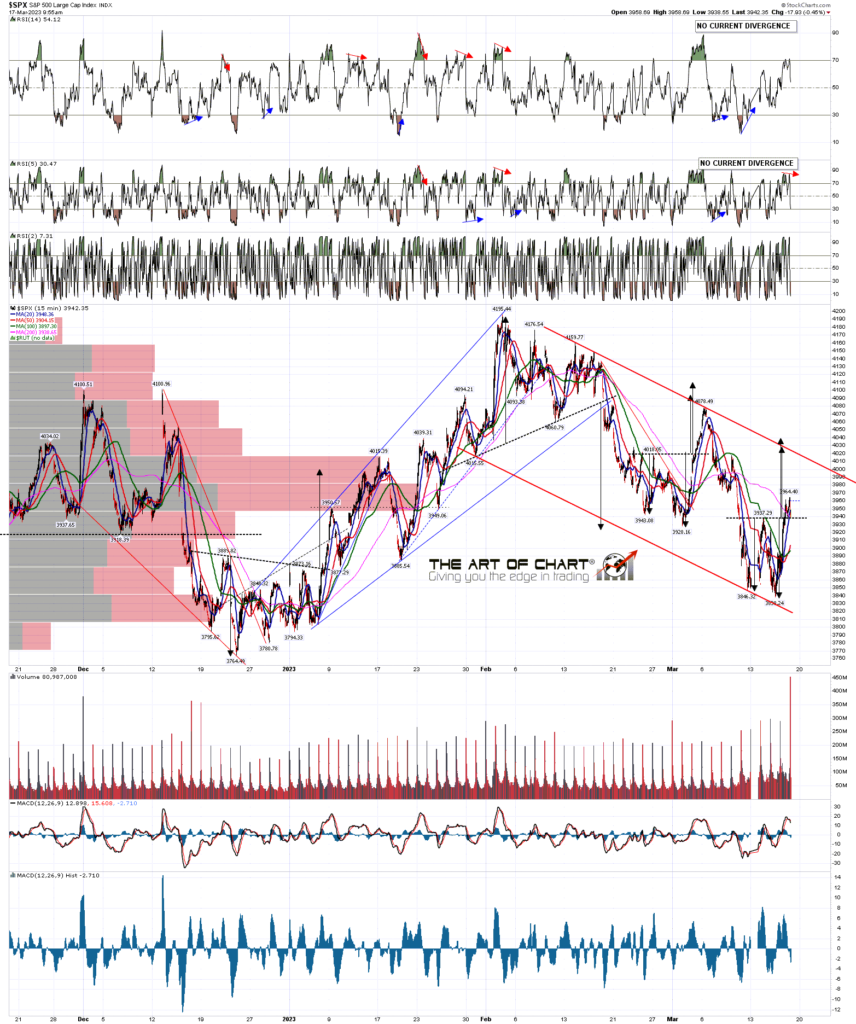
There was also a possible hourly RSI 14 buy signal brewing on the SPX chart that fixed yesterday and has not yet reached target. These generally reached target and that favors at least some more upside here.
SPX 60min chart:
I posted a very decent looking bull flag channel/wedge on NDX on Wednesday last week, and as NDX has been relatively strong in this latest decline, that had not broken down, and then also broke up yesterday. This is a high quality flag with three touches on both support and resistance, and has broken up with a clear target at a retest of the February high at 12881. I’m not seeing anything currently to suggest that won’t make target.
NDX 15min chart:
There is however some very significant resistance on the way to these upside targets on SPX, particularly today as today is the last day of the week. The first of those is the daily middle band, currently in the 3968 area and effectively tested at the highs yesterday and so far today.
SPX daily BBs chart:
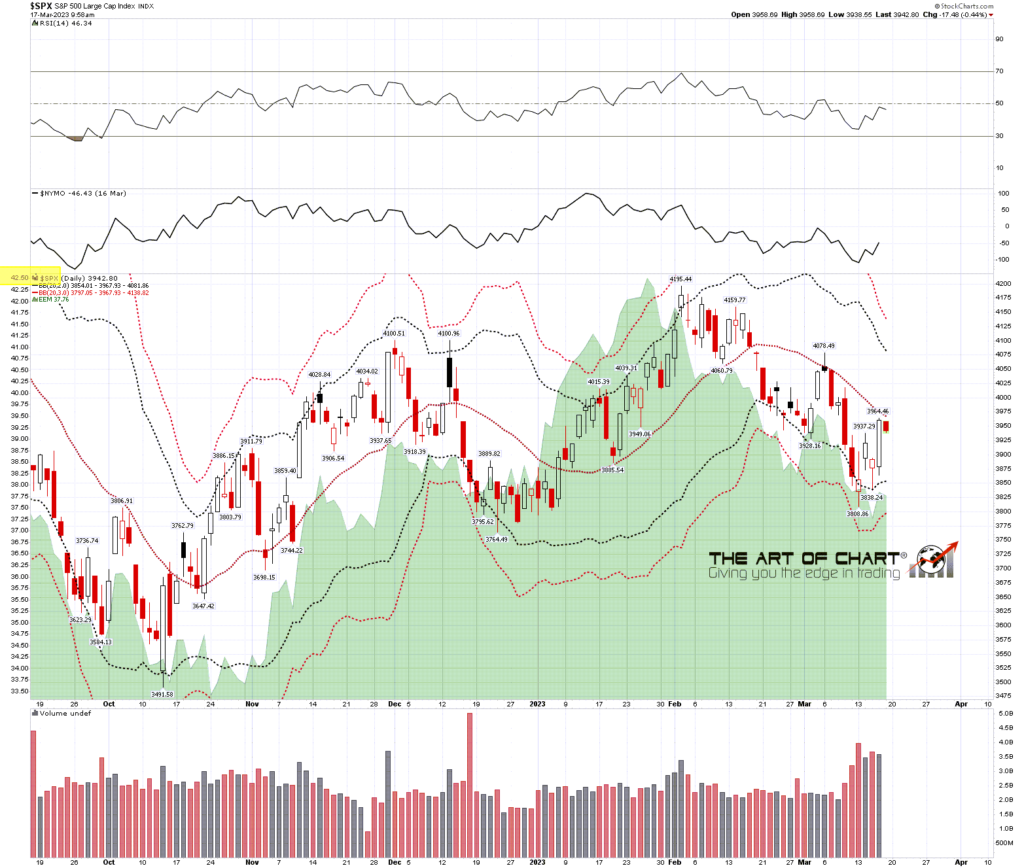
The SPX weekly middle band is in the same area, currently at 3967, so this is a strong double resistance level. That is also backed up by the 50 week MA, currently at 3975, and both of these levels are important on the weekly close basis today, though a break back above both today could of course be rejected next week.
SPX weekly chart:

I’ve been watching the bank troubles this week with some interest. One thing that has really changed over the last couple of decades is that bank runs can happen a lot faster now that money is now generally transferred electronically. There aren’t the queues that used to be the marker of a bank run.
Another thing is something I wrote about as a risk a decade or so I think, and that is that stuffing banks full of long term bonds with very low coupons as their capital base would likely end badly when interest rates normalised as they would then be sitting on huge capital losses that would become a big problem if they were forced to liquidate those assets (in a bank run for instance) rather than hold them to maturity.
The solution seems simple though. As long as the Fed is prepared to stand behind the banks and provide liquidity this problem, mainly created I would note by the Fed, shouldn’t be an issue. This is an issue however in a situation where a bank becomes insolvent for other reasons but it is a fix that can be applied without lowering interest rates (inflationary), large bailouts (inflationary) or printing money (inflationary). At the moment therefore this currently minor bank panic doesn’t look that serious to me, though I could be mistaken.
SPX is testing some serious resistance here and it may be that if that resistance is going to be broken, then that won’t happen until Monday. This is a nice bullish setup to go at least a bit higher in the short term though and it may well play out. We’ll see.
On Sunday last week we did our monthly free public Chart Chat at theartofchart.net, and if you missed that you can see that here, or on our March Free Webinars Page.
Everyone have a great weekend 🙂
If you are enjoying my analysis and would like to see it every day at theartofchart.net, which I co-founded in 2015, you can register for a 30 day free trial here. It is included in the Daily Video Service, which in turn is included in the Triple Play Service.
 17th Mar 2023