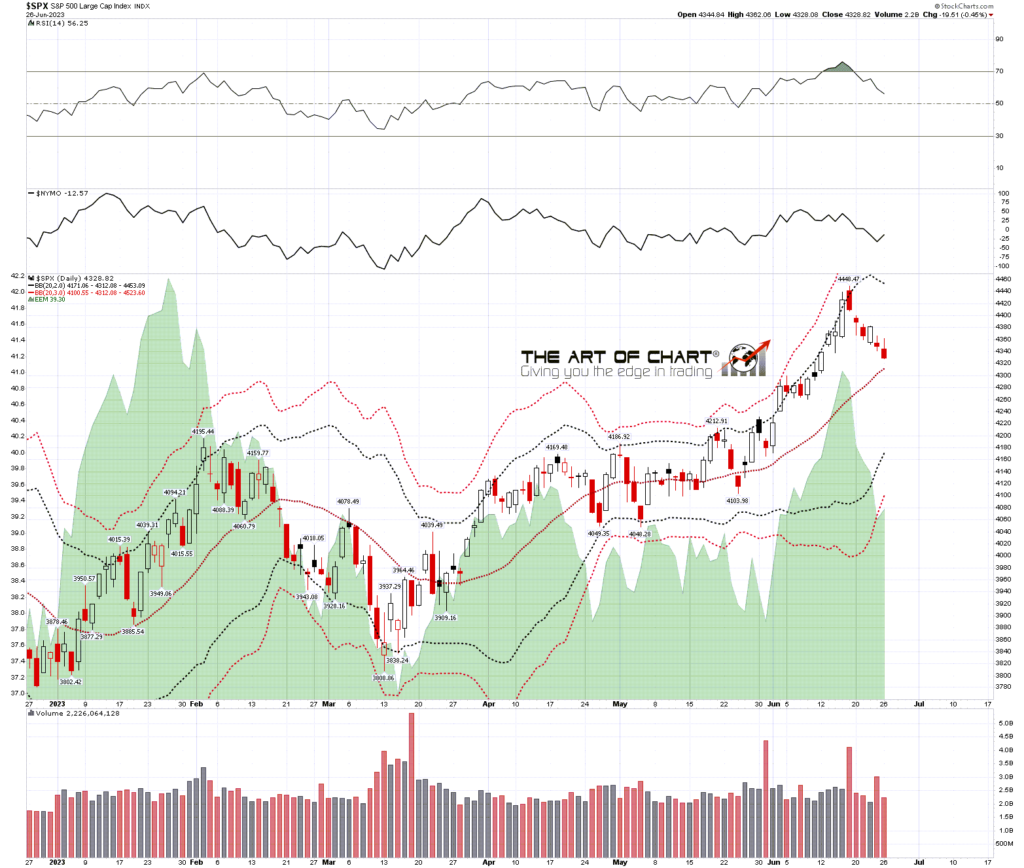
On the bigger picture, a reversion to the mean retracement may well be in progress here. If so, the obvious target for that retracement would be a hit and possible break below the 45dma, currently at 4212 and a decent match with the 38.2% retracement of the move up from the October low at 4205. If we were to see a move of that magnitude we might well first see a topping pattern form.
SPX daily 45dma chart:
The usual reversal pattern that forms on SPX/ES is some kind of a double top or bottom. Historically that happens about 70% of the time, with the next most likely option being an H&S. Is there a case for either here?
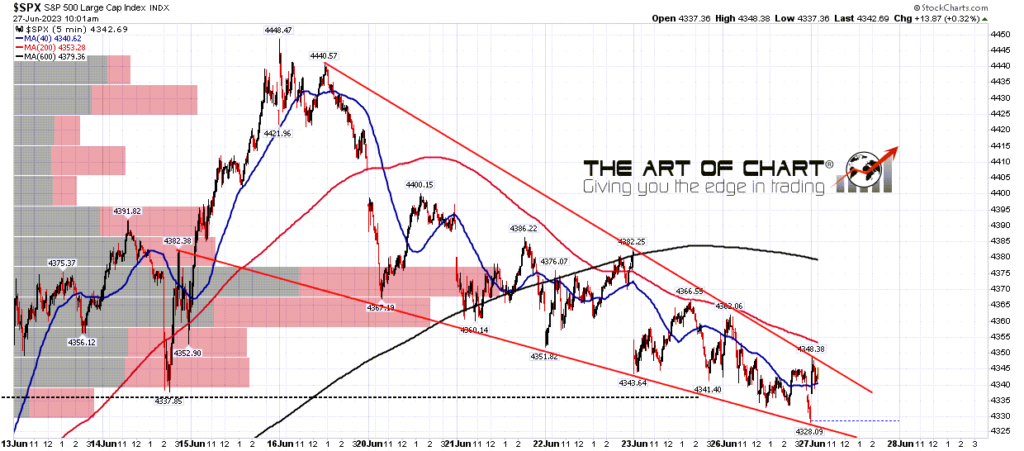
Well there is a well formed falling wedge from the last high on SPX. That may well be a bull flag, and on a break up over wedge resistance in the 4350 area could set up that high retest. There is also a decent looking H&S neckline in the 4338 area that was holding well for a day or two, but the move below it yesterday is weakening the H&S option. A test of the SPX daily middle band from here would weaken that significantly further.
There is a third option here. The falling wedge itself could break down, as they do 30% of the time, in effect becoming that topping pattern. I’ve included a close up view of the falling wedge on the 5min chart shortly after the open this morning. It is a very nicely formed example of a bull flag wedge.
All three of these options could yield targets in the 4200 area, satisfying the reversion to the mean target.
SPX 15min & 5min charts:
Is there anything supporting a move directly down from here? Yes, a decent quality H&S has formed on NDX and has broken down with a target in the 14290 area. That cuts both ways of course, a rejection back up over the right shoulder high at 15044 would make this, in effect, another bull flag setup with a target back at a retest of the last high, but a continuation down would support a further break down on SPX.
NDX 15min chart:
So what are we likely to see happen next on equity indices? Well the bull flag wedge on SPX is a very good example, and topping patterns on SPX lean about 70% towards double tops and bottoms. The second most popular type of reversal pattern is an H&S and wedges breaking against expectation are possibly a distant third. There is a second decent looking flag on IWM and, in the event that the H&S on NDX fails, in effect a third. The odds favor a break up next here on SPX, we’ll see whether we get that. In the event that we see a break down directly towards the 4200 area instead, the first clear signal will be a break and conversion of the daily middle band.
The historical stats for yesterday were very bearish and delivered, but the stats for the next couple of weeks are a different story, mostly neutral other than bullish leans on Thursday and a very bullish lean on Monday 1st July. The next strongly leaning bearish day is at opex on Friday 21st July. This would be a decent opportunity to see a high retest.
We are running our July 4th sale with deep discounts on annual memberships at theartofchart.com. If you’re interested you can see the page and offer here.
If you are enjoying my analysis and would like to see it every day at theartofchart.net, which I co-founded in 2015, you can register for a 30 day free trial here. It is included in the Daily Video Service, which in turn is included in the Triple Play Service.


 27th Jun 2023