The SPX daily upper band ride finished a few days ago. SPX has gone higher in the last week, but not quite reached the upper band again, and there is no particular reason to think that the daily upper band ride might resume.
SPX hasn’t quite reached the obvious trendline resistance from the October 2023 low and, if that is going to be hit, I have that now in the 5045 SPX area.
SPX daily BBs chart:
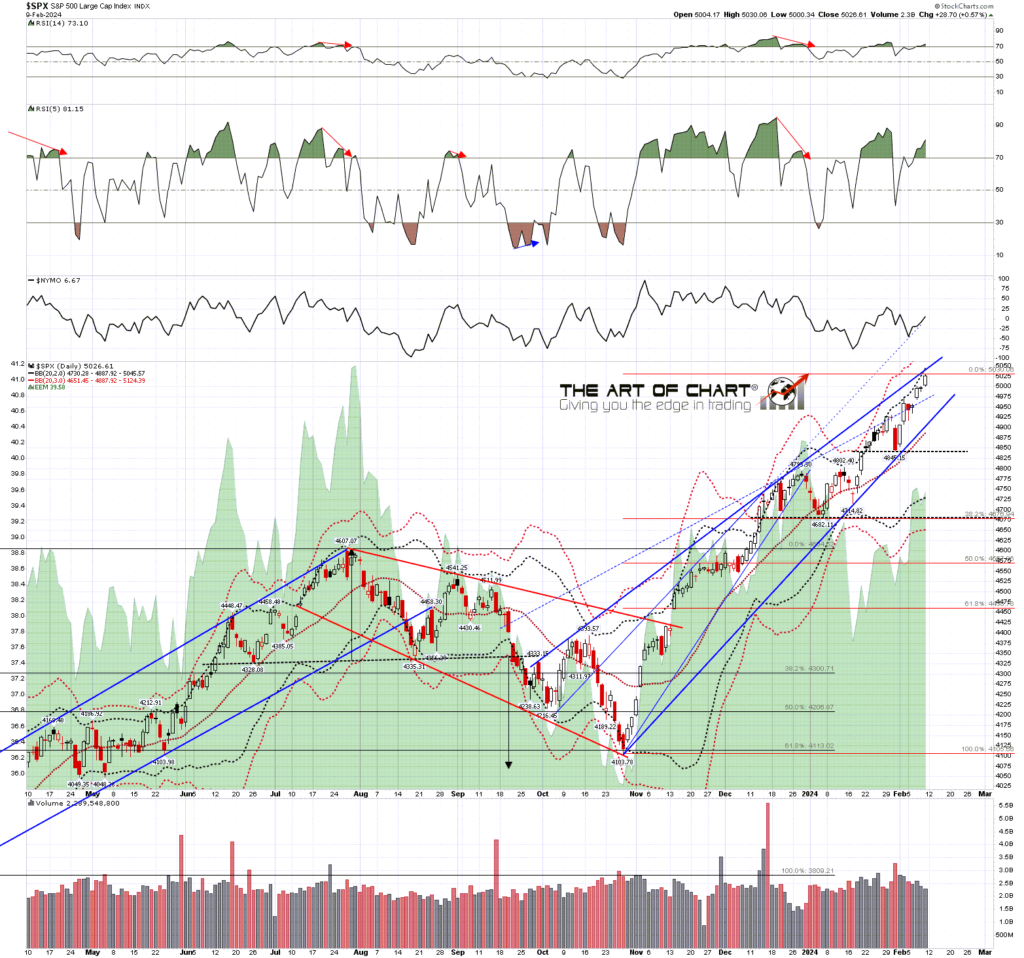
When I was looking at upside targets on SPX in my last post a week ago, the main one was the rising megaphone resistance from the bear market low in October 2022. That was hit on Friday, and SPX is now therefore in a significant inflection point. If we are going to see a decent retracement of the move up from the October 2023 low, then this is the obvious place to see that start. We could still see an overthrow to hit the short term resistance trendline too, but topping out in this area seems more likely.
SPX daily 45dma chart:

Main resistance has not just been hit on SPX here. A very nice resistance trendline from the 2022 bear market low has now also been hit on NDX and again, this would be the obvious place to see at least a decent retracement.
NDX daily BBs chart:

Dow has also hit a very nice rising channel resistance trendline from the 2022 bear market low. Again, this would be the obvious level from which to retrace.
INDU daily BBs chart:

What I don’t have here is a big resistance trendline being hit on IWM. That is the minority report that is mentioned in the title. There is a decent looking rising channel in place from the October 2023 low with a lot of potential upside in there until that breaks. Since I capped this chart at the weekend the shorter term resistance trendline has been broken, as IWM is the only index that has still been heading higher so far this morning.
IWM 60min chart:
SPX has gone up some 930 handles from the October low in what has almost been a straight line, and that is not a situation that tends to last long. SPX is likely to deliver a decent retracement of that move up soon, and this is the obvious place to do that from. We’ll see how that goes.
I’ve stopped using a custom domain for my blogger posts so the address for those has reverted back to https://channelsandpatterns.blogspot.com/
If you are enjoying my analysis and would like to see it every day (including a daily premarket video) at theartofchart.net, which I co-founded in 2015, you can register for a 30 day free trial here. It is included in the Daily Video Service, which in turn is included in the Triple Play Service.
 12th Feb 2024