After my post on Friday, SPX spiked up into the trendline I had posted on the SPX hourly chart, and that was the very nice rising wedge resistance trendline from the March 2020 low. That high was retested this morning, the level was respected and weak hourly RSI 14 and RSI 5 sell signals have now fixed.
SPX 60min 15Mo chart:
Looking through my other charts on Saturday though that was only part of the story. Friday’s high on SPX was also a perfect hit on a shorter term rising wedge from the late October low.
SPX 60min 5Mo chart:

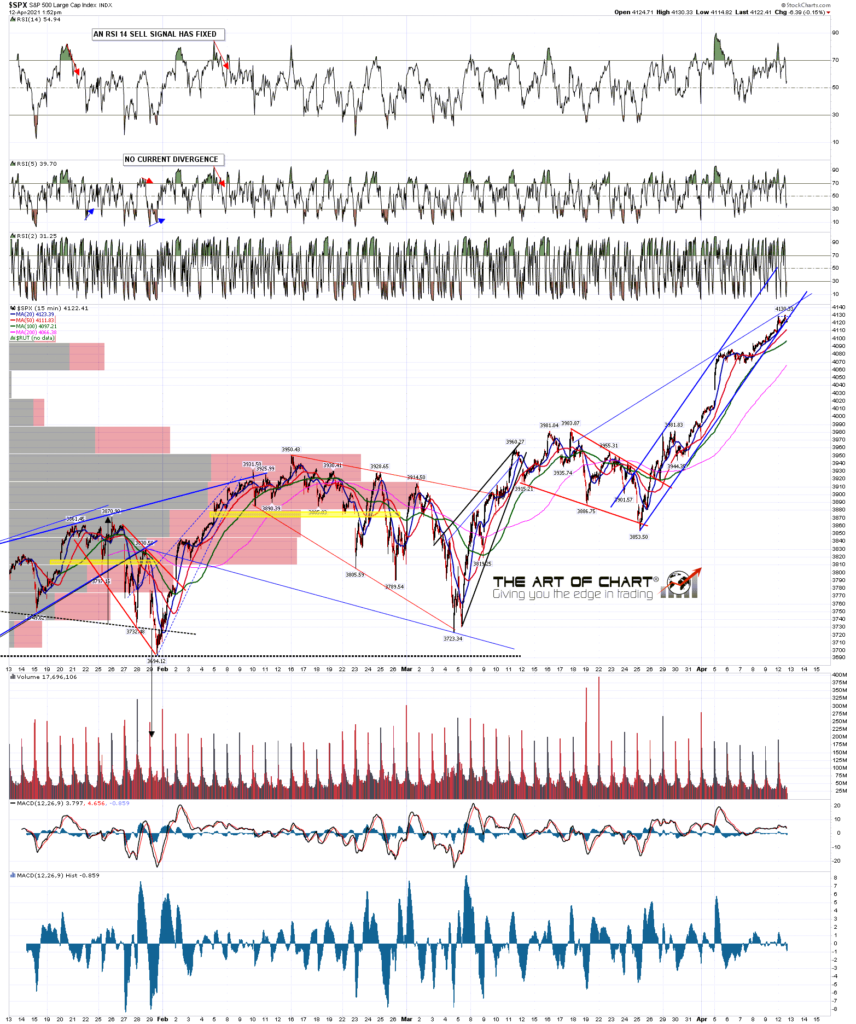
That still wasn’t all though. Looking at the SPX 15min chart that high was also a perfect hit on the ideal rising wedge resistance trendline from the late April low at 3853.50, so that was three intersecting trendlines on three rising wedges on SPX nested within each other like matryoshka dolls.
Is this a setup where I would be expecting those trendlines to hold as resistance into a retracement starting here? Generally yes, though there are no certainties in analysis, or trading, or indeed in the world in general.
SPX 15min chart:
Backing up the trendlines was the strong punch above the weekly upper band at Friday’s close. This generally delivers (70%)+ in last 15 years, a short term high with at least a consolidation lasting several weeks and often a retracement to the weekly middle band, currently 3850 area, or lower band, currently 3600 area.
SPX weekly chart:

Since I capped these charts the smallest SPX wedge has starting breaking down and sell signals have now fixed on both the hourly and 15min charts. A small double top has formed with on a sustained break below 4114 SPX would look for the 4099 area.
I forgot to mention on Friday that we were doing our monthly free public Chart Chat at theartofchart.net yesterday If you’d like to see that the recording is posted on our April Free Webinars page, close to the top of the page.
We are also doing a free webinar an hour after the close on Friday on ‘Trading Commodities – Setups And Approaches’. If you’d like to attend you can register for that here.
I’m going to try to get back into a routine of doing two or three posts a week so I’m expecting to publish at least one more post by Friday.
 12th Apr 2021