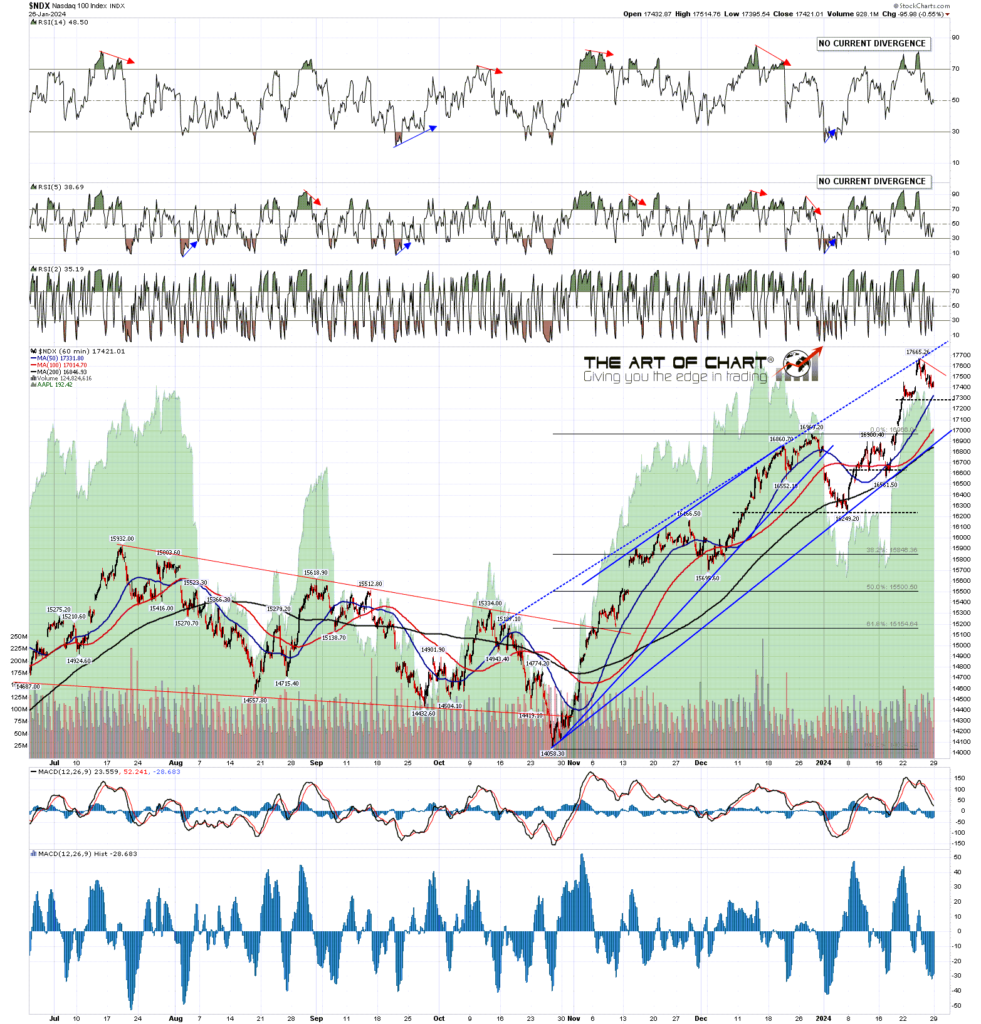
Friday 19th January was a disappointing day for bears. SPX made a new all time high, which had been obvious unfinished business above, and when ES was in the 4850 area there was an hour or so when there were lovely little double top setups on SPX, NDX and Dow, hourly negative divergence on all of ES, NQ, RTY and YM, and a beautiful inflection point that could have delivered a significant high and a healthy retracement on SPX back into the 4500s and potentially a lot further.
Any inflection point is a choice for the market to make and can always go either way, the inflection point broke up, the hourly negative divergence was lost, and the lovely little double top setups vanished. I was sorry to see that happen but the market is never what we might want to be, it just is what it is. As analysts we analyse the market in front of us, and as traders we trade it. There is no such thing as certainty in the market and it is really important not to get married to any particular scenario.
So where does this break up leave us? Well, equity indices are certainly looking short term overbought, and there are some resistance trendlines that I had pencilled in as options on a break up that have been hit, so I’m watching the overall setup here with great interest to see what happens here.
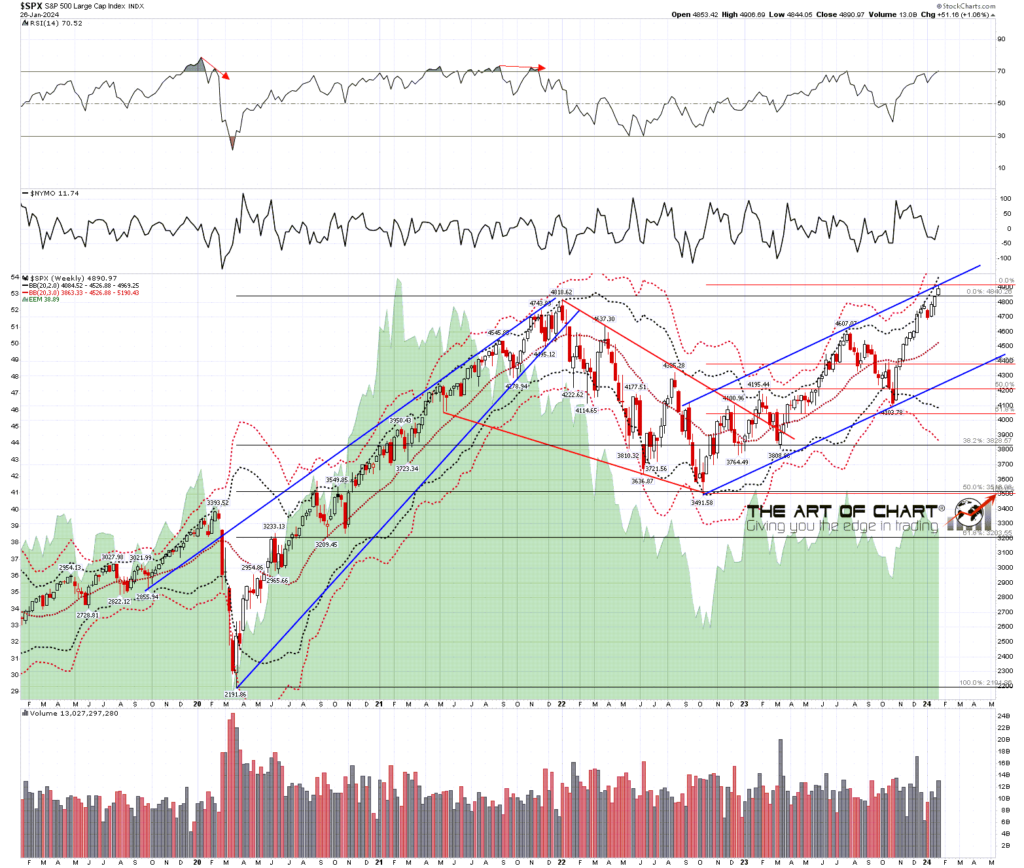
On my SPX weekly chart a possible resistance trendline has been hit for the move up from the 2022 low, and there is a possible weekly RSI 5 sell signal brewing here.
SPX weekly BBs chart:
On the SPX daily chart there is also a hit of a decent possible rising wedge resistance trendline from the October low at 4103.78, so with the weekly chart this is a very interesting possible resistance area.
What I would note though is that SPX has now been on a daily upper band ride for the last six days. That could end here, of the last three of these they lasted seven, six and eleven days respectively, but as long as price tests the daily upper band every day that is ongoing, and could carry SPX higher. I would note that if price falls away slightly from the upper band for a day or two and then touches it again that does not end the band ride. An example of that can be seen in the eleven day upper band ride last June.
SPX daily BBs chart:
There are two decent shorter term double top setups here, which I’m watching with particular interest today because this is the only historically bearish leaning day this week. On SPX (not shown below), that double top setup, on a sustained break below 4865.98, would look for a target in the 4826-8 area.
On the Dow Industrials 15min chart below the little double top setup, on a sustained break below the 37.8k area, would be looking for the 37.4k area.
I am wondering whether these two little double top setups on SPX and Dow might play out today and into tomorrow, setting up likely retests of these highs afterwards and in the process setting up some negative RSI divergence on their daily charts. We’ll see.
INDU 15min chart:
What are the odds that a significant high is forming here? Possibly but, SPX and NDX went through the obvious areas to see that and, evidence suggesting a serious high here looks thin. That said, equity indices look short term overbought and I’m expecting to see some retracement in the not too distant future, but until that sets up more I couldn’t put any targets on that yet.
Has a recession been avoided? Probably not, as the inverted yield curve has been a really good predictor of these in the past, but historically the recession starts near the time that the inverted yield curve uninverts, and that hasn’t happened yet. It may not happen for several months yet.
Has inflation been conquered? Not yet though it does look promising. Interest rates are unlikely to return to the lows seen over the last decade though. Real interest rates hit a low then that as far as I am aware had never been seen before, and may well never be seen again. Normal interest rates are two to three percent over the rate of inflation so really interest rates have just reverted back to that long term mean over the last couple of years. I suspect that interest rates in the 4% to 5% range are here to stay, as long as inflation remains low, and as long as government spending across the western world can be brought back under control, which is a significant unknown here as that has been really out of control in recent years, with debt to GDP ratios in major economies that have never been seen before outside an ongoing world war. There will need to be some adjustment to that., particularly in the real estate markets, and if government spending does not come under control, interest rates will likely rise a lot further over coming years.
I’ll do a post on the January barometer next week, which unless we see some real bear fireworks in the first three days of this week will be predicting an up year for SPX in 2024. This adds to my comments before Xmas that presidential election years tend to be positive for equities. We’ll see how it goes but, so far in 2024 at least, advantage bulls.
I’ve stopped using a custom domain for my blogger posts so the address for those has reverted back to https://channelsandpatterns.blogspot.com/
If you are enjoying my analysis and would like to see it every day (including a daily premarket video) at theartofchart.net, which I co-founded in 2015, you can register for a 30 day free trial here. It is included in the Daily Video Service, which in turn is included in the Triple Play Service.


 22nd Jan 2024