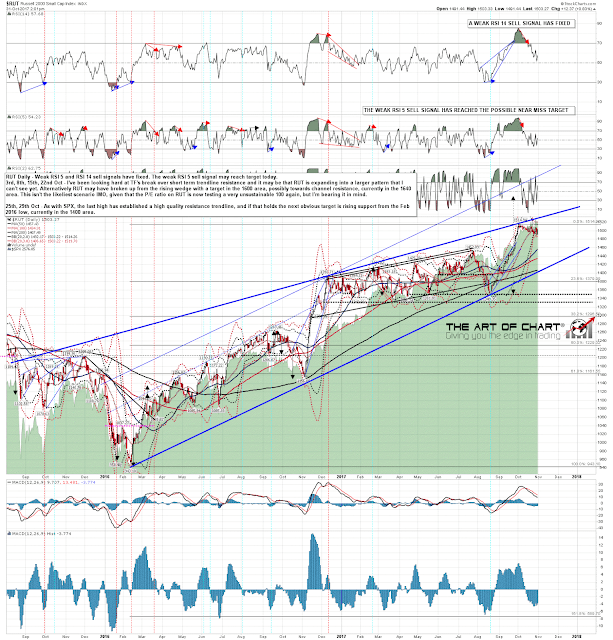
Are the equity indices topping out here or not. I think yes, though likely just for a retracement before higher highs. SPX is retesting good trendline resistance, is on a strong daily RSI 5 / NYMO sell signal, and a daily RSI 14 sell signal is now brewing as well. Another retest of the all time high would establish possible nested double tops. Maybe. SPX daily chart:
NDX broke through initial channel resistance and is testing a slightly higher and better alternate channel option. NDX daily chart:
It’s hard to read the consolidation on RUT in recent days as anything other than a bull flag inviting a retest of the high, so that may be unfinished business above. RUT daily chart:
The ES, NQ and TF futures charts below were done before the RTH open for Daily Video Service subscribers at theartofchart.net. If you are interested in trying our services a 30 day free trial is available here.
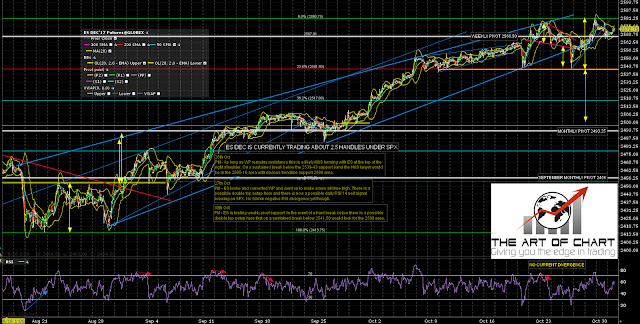
A decent nested double tops setup on ES if the all time high is retested and rejected. If so a hard break below weekly pivot (marked) should set the downside ball rolling. ES Dec 60min chart:
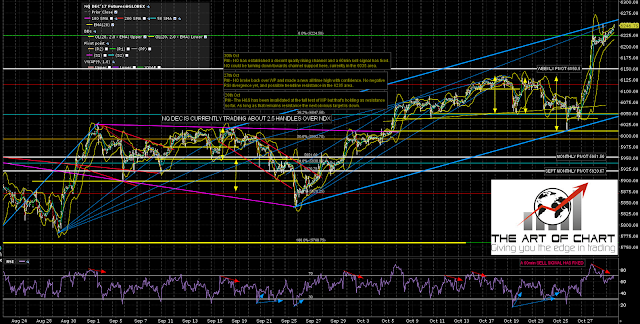
NQ is already on a 60min sell signal and a 60min RSI 14 sell signal is brewing on NDX. NQ Dec 60min chart:
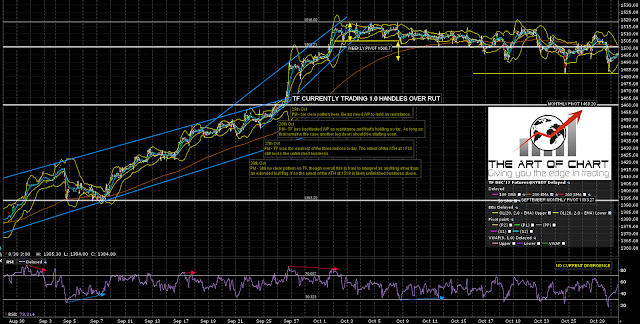
Not much to say about TF other than this very much looks like a retracement / flag. If so the ATH should be retested before any reversal. TF Dec 60min chart:
If ES can break the all time high with any confidence then Stan has the next target in the 2610 area.
I’ll leave you with my favorite horror parody from YouTube. 🙂
Everyone have a great Halloween. 🙂


 31st Oct 2017