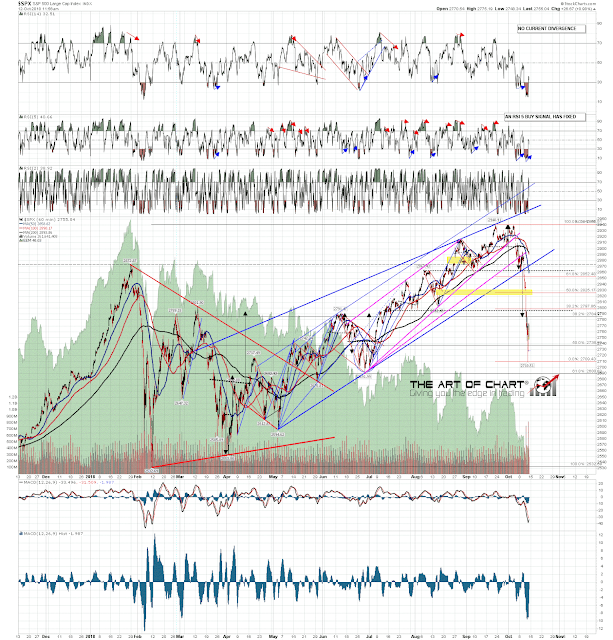
I was saying after the SPX support trendline touch a few days ago that having a strong three-touch support trendline cuts both ways, in that it is strong support while it holds, but can get ugly fast when it breaks. The strength of this push down after the support trendline broke on Wednesday morning was extremely impressive.
That move may be bottoming out for the moment and, if so, that should be the end of wave A, with a wave B rally in progress now or soon, and a likely wave C down after that to complete this move from the high. There are a number of possible options for the wave C low, but my favorite would be a retest of the 2018 low at 2532.69, just under the annual pivot at 2538. There is a possible H&S neckline at that level. If SPX does a 50% retracement from the current low then the target would be in the 2825 area, though there is impressive looking resistance in the 2790 – 2800 area that may hold as resistance.
Full Premarket Video from theartofchart.net – Update on ES, NQ, SPX, NDX, RUT, CL, NG, GC, SI, HG, ZB, KC, SB, CC, ZW, ZC, ZS, DX, EURUSD, USDJPY, USDCAD, AUDUSD:
SPX 60min chart:
Everyone have a great weekend. 🙂

 12th Oct 2018