Apologies for the lack of updates this week. It has been extremely busy. I should be back on a more normal schedule next week. Stan and I are doing our monthly free public webinar on FAANG stocks and key sectors tonight, and if you’d like to attend you can register for that on our June Free Webinars page.
It has been an irritating week on the indices, from a promising start on ES/SPX and NQ/NDX, with high quality H&S patterns breaking down on all four, with then the H&S patterns on NQ/NDX failing into higher highs, and then the H&S on ES being invalidated at the highs last night, leaving the H&S on SPX as the sole survivor of the four patterns, having escaped invalidation by 0.13 handles at the highs yesterday. That still has an open target in the 2725 area.
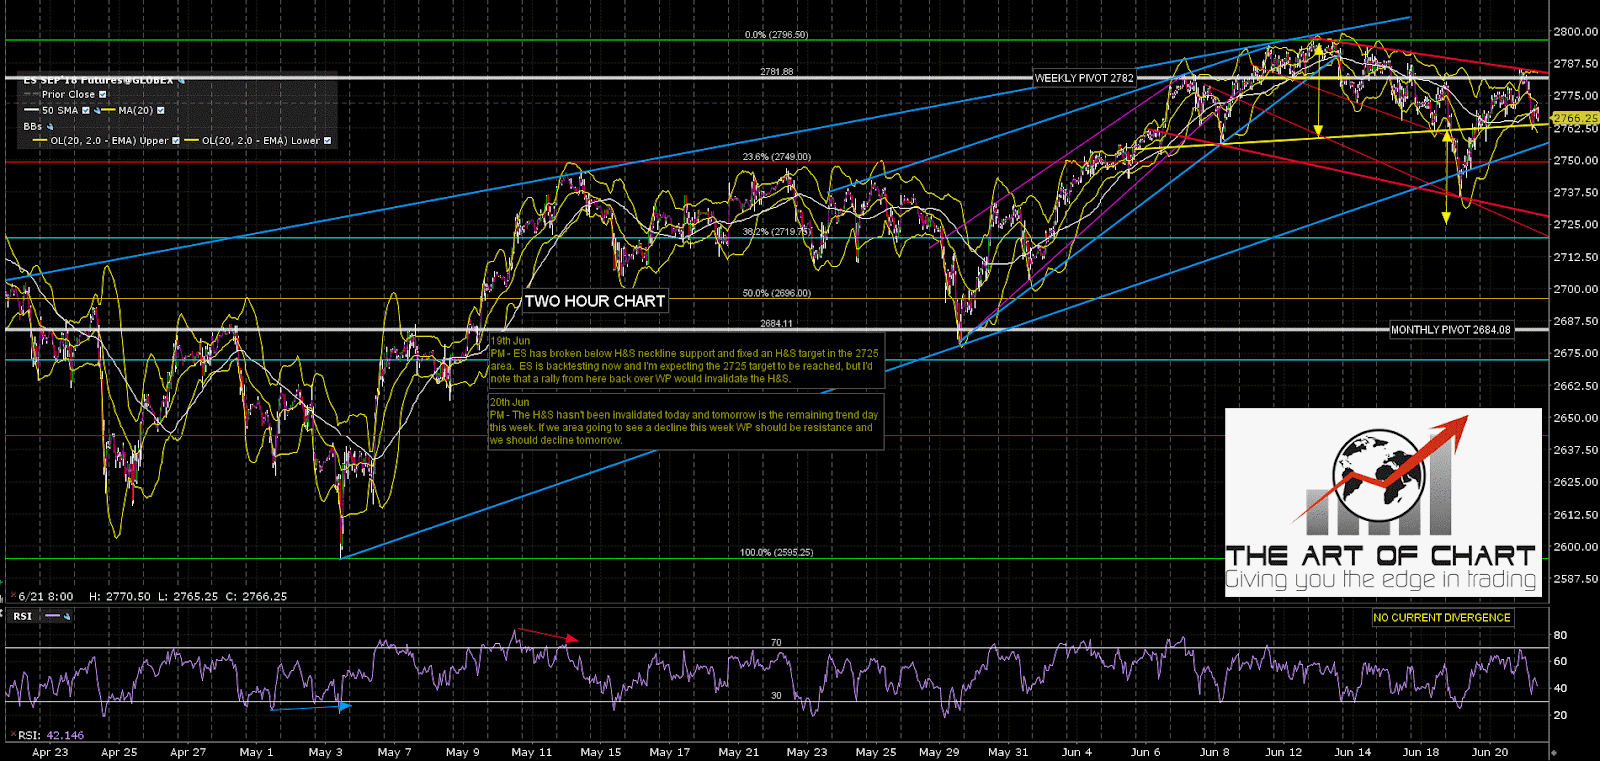
So what is actually happening here? Well the overnight high on ES was very interesting as it established a three touch declining resistance trendline from the high. That was interesting because it suggests that a flag pattern is forming and, as long as that resistance holds, then ES should be on the way to confirm a pattern support trendline. After I recorded the video below I had a careful look to see if I could identify likely targets and I found two, both falling megaphone support alternate trendlines, and by the close today they would be in the 2728 and 2720 areas respectively. If ES trends down today, which I was talking about as a strong probability on the premarket video below, and is looking increasingly likely at the time of writing, then the target for this move is likely to be one of those trendlines.
In terms of quality I like the higher trendline better, but if the touch (and likely reverse) was to be today I would note that the lower trendline would be a strong match with the 38.2% fib retracement of the broken rising wedge in the 2720 area, and that would normally be my minimum retracement target on a broken wedge like this one. The H&S target on SPX would be satisfied on a hit of either option. If that low was to be made tomorrow then the higher trendline would be a better match.
So what would a retracement low in this area mean? Well the setup would be a clear bull flag megaphone. The low would be a clear timing match with Stan’s low window for this retracement with the middle of that low window on Monday 25th June, and on a break up from the flag the minimum target would be a retest of the June high, with very possible continuation on to a retest of the all time highs on ES/SPX. We will see how this develops.
Full Premarket Video from theartofchart.net – Update on ES, NQ, CL, NG, GC, SI, HG, ZB, KC, SB, CC, ZW, ZC, ZS, DX, EURUSD, USDJPY, USDCAD, AUDUSD:
ES Sep 60min chart:
 21st Jun 2018