Apologies for the slow rate of updates this week. Stan and I are distracted while running our first Trader’s Boot Camp, lasting about four weeks and lasting until the end of next week. We are teaching basic TA and trading methods for both swing and day trades. This is mainly aimed at existing subscribers, on the basis that a profitable subscriber is a happy subscriber, but we are starting to promote this to non-subscribers for the next one starting on 22nd May, so if you might be interested, have a look here. We are charging $499 per seat for non-subscribers, which seemed a fair price to us, but for some reason is by far the cheapest we have seen anywhere on the web.
I should also mention that our monthly free public Chart Chat is on Sunday and you can sign up for that on our May Free Webinars page. We’ll be covering the usual range of thirty to forty instruments across equity, bond, currency, precious metal and commodity markets.
On SPX the triangle setup that I was looking at on Tuesday morning is playing out so far and I’m looking at that on the video below, which may be the first full version of the premarket video, that I do every morning, that I have ever posted here. Full Premarket Video from theartofchart.net – Update on ES, NQ, and TF (at the start) and then DX, CL, NG, GC, ZB, HG, KC, SB, CC, ZW, EURUSD, GBPUSD, USDJPY, USDCAD, AUDUSD, and NZDUSD:
On SPX, a decent quality falling channel has formed from the April high and with that channel we are looking for a test of triangle support, now in the 2570 area. The low window and daily historical stats are looking for that touch tomorrow in all probability. A break over channel resistance, now in the 2670 area, likely signals that the low has been made early. In the video, I’m looking at the smaller triangle setup on NQ that is suggesting that we might start the day with a strong rally before heading down to target. SPX 60min chart:
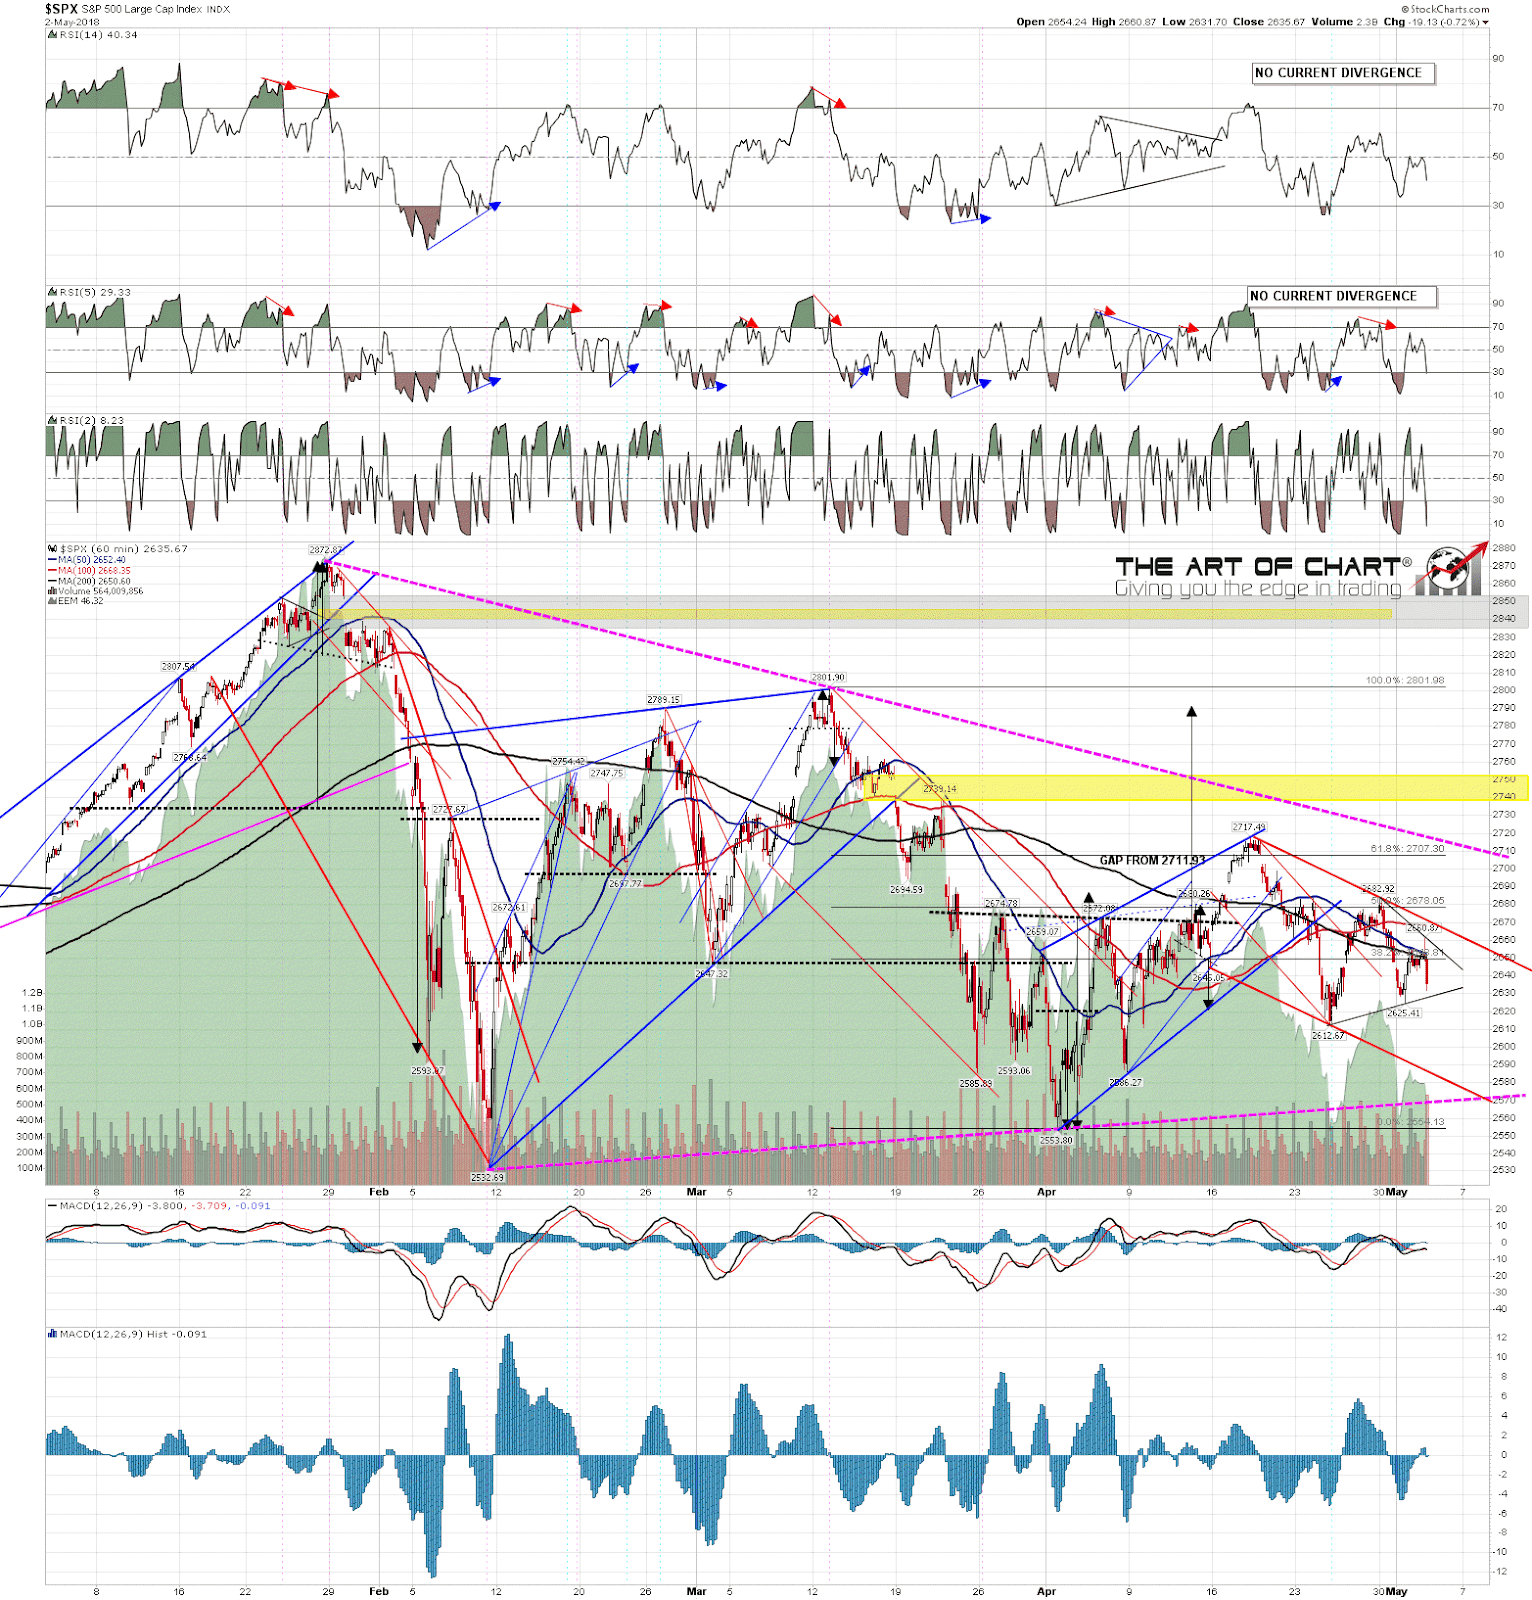
So what about the Three Day Rule target at a full retest of the April low at 2553.80? Well, the two small exceptions to the rule were near misses while triangles were forming. A larger triangle is forming here, and if that triangle support is tested and holds then that might be a larger near miss caused by the larger triangle. I’d expect to see that triangle support test, but won’t be relying on the full Three Day Rule target unless that support trendline breaks.
 03rd May 2018