The short term resistance on the SPX 5dma and 50hma that held for much of last week eventually broke and delivered the high retest and marginal higher high that I was looking for in the event of that break. So what now?
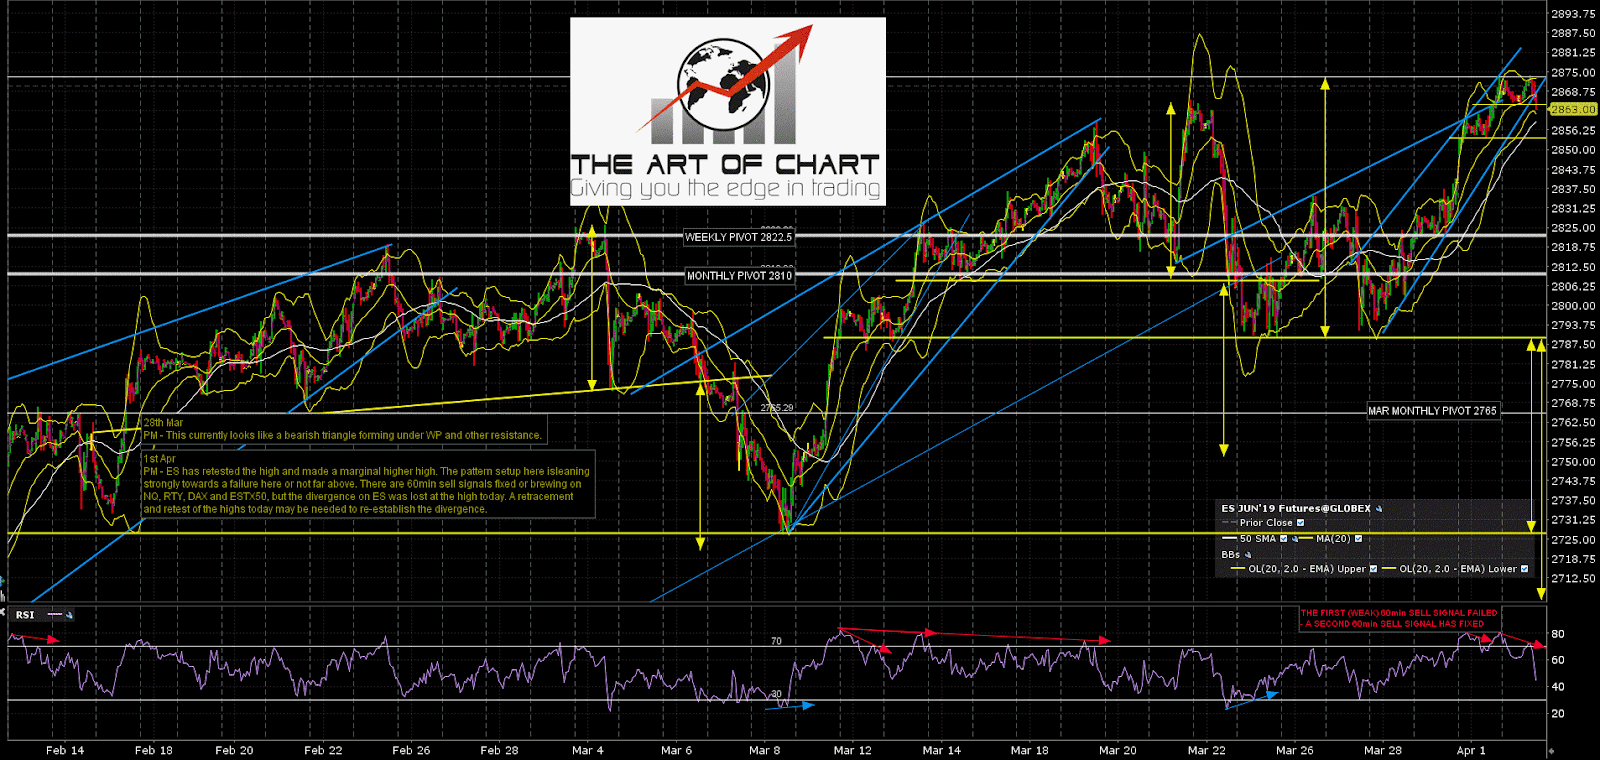
Well I’m expecting this to be the second high of a double top or possibly making the head on an H&S. 15min sell signals have fixed on SPX and an hourly sell signal has fixed this morning on ES. This high could already be in, and the rising wedge on ES from the last low has now broken down, which is promising. A small double top has broken down slightly towards a possible H&S neckline in the 2854 area, and there is now a substantial double top in place which on a sustained break below 2789 would look for alternate targets in either the 2728 or 2706 area.
ES Jun 60min chart:
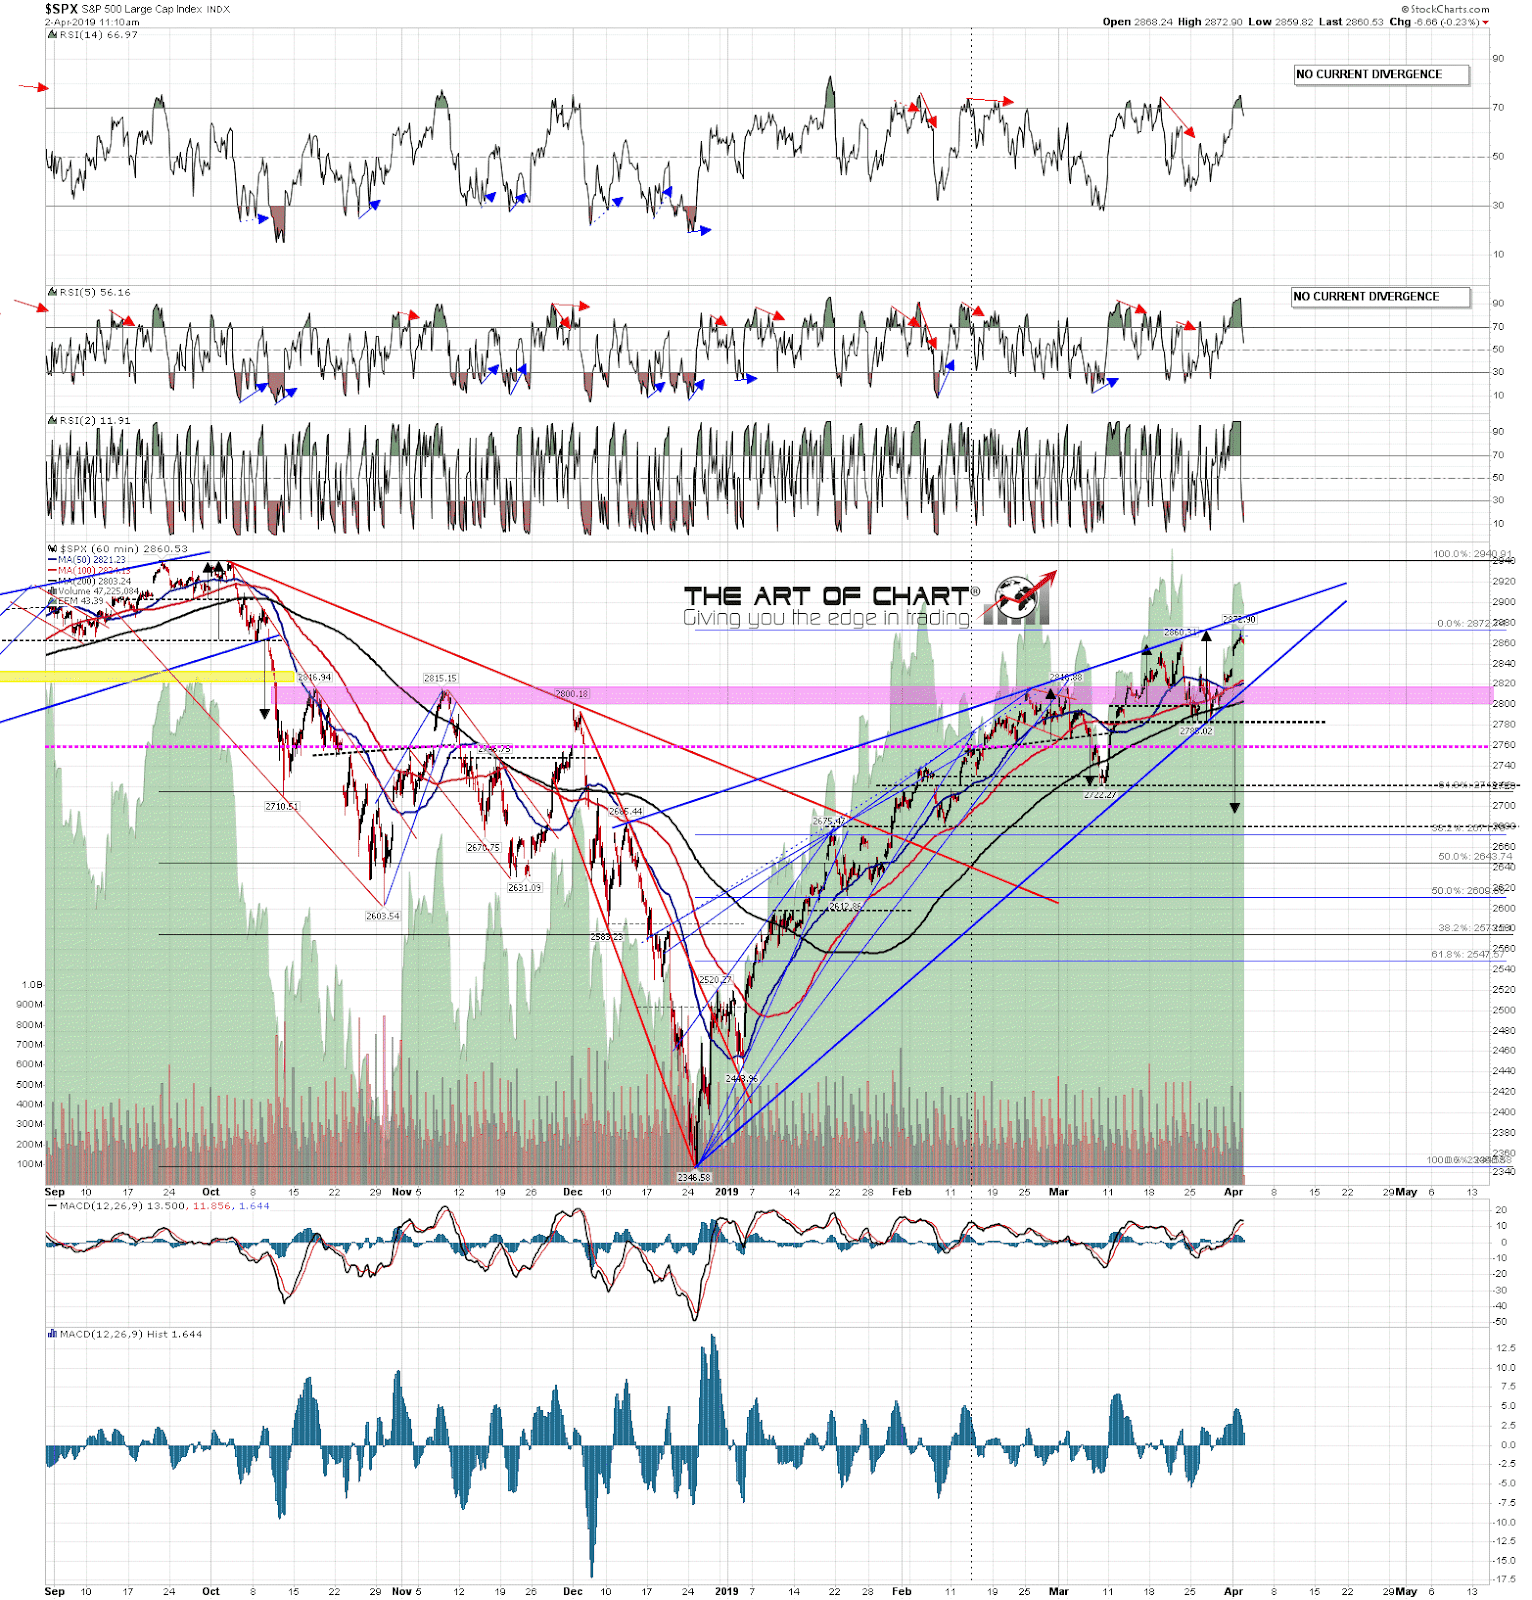
However I would note that there is at least some reason to think that SPX/ES might need to go a little higher. There is currently no negative divergence on the SPX hourly RSIs and if we were to see a retracement here followed by a higher high, then I have a potential trendline target on SPX in the 2885-2900 area, depending on the time taken to reach those trendlines. On SPX this last retest could obviously fail on a very marginal higher high, but if not then the next target higher looks like those trendlines.
SPX 60min chart:
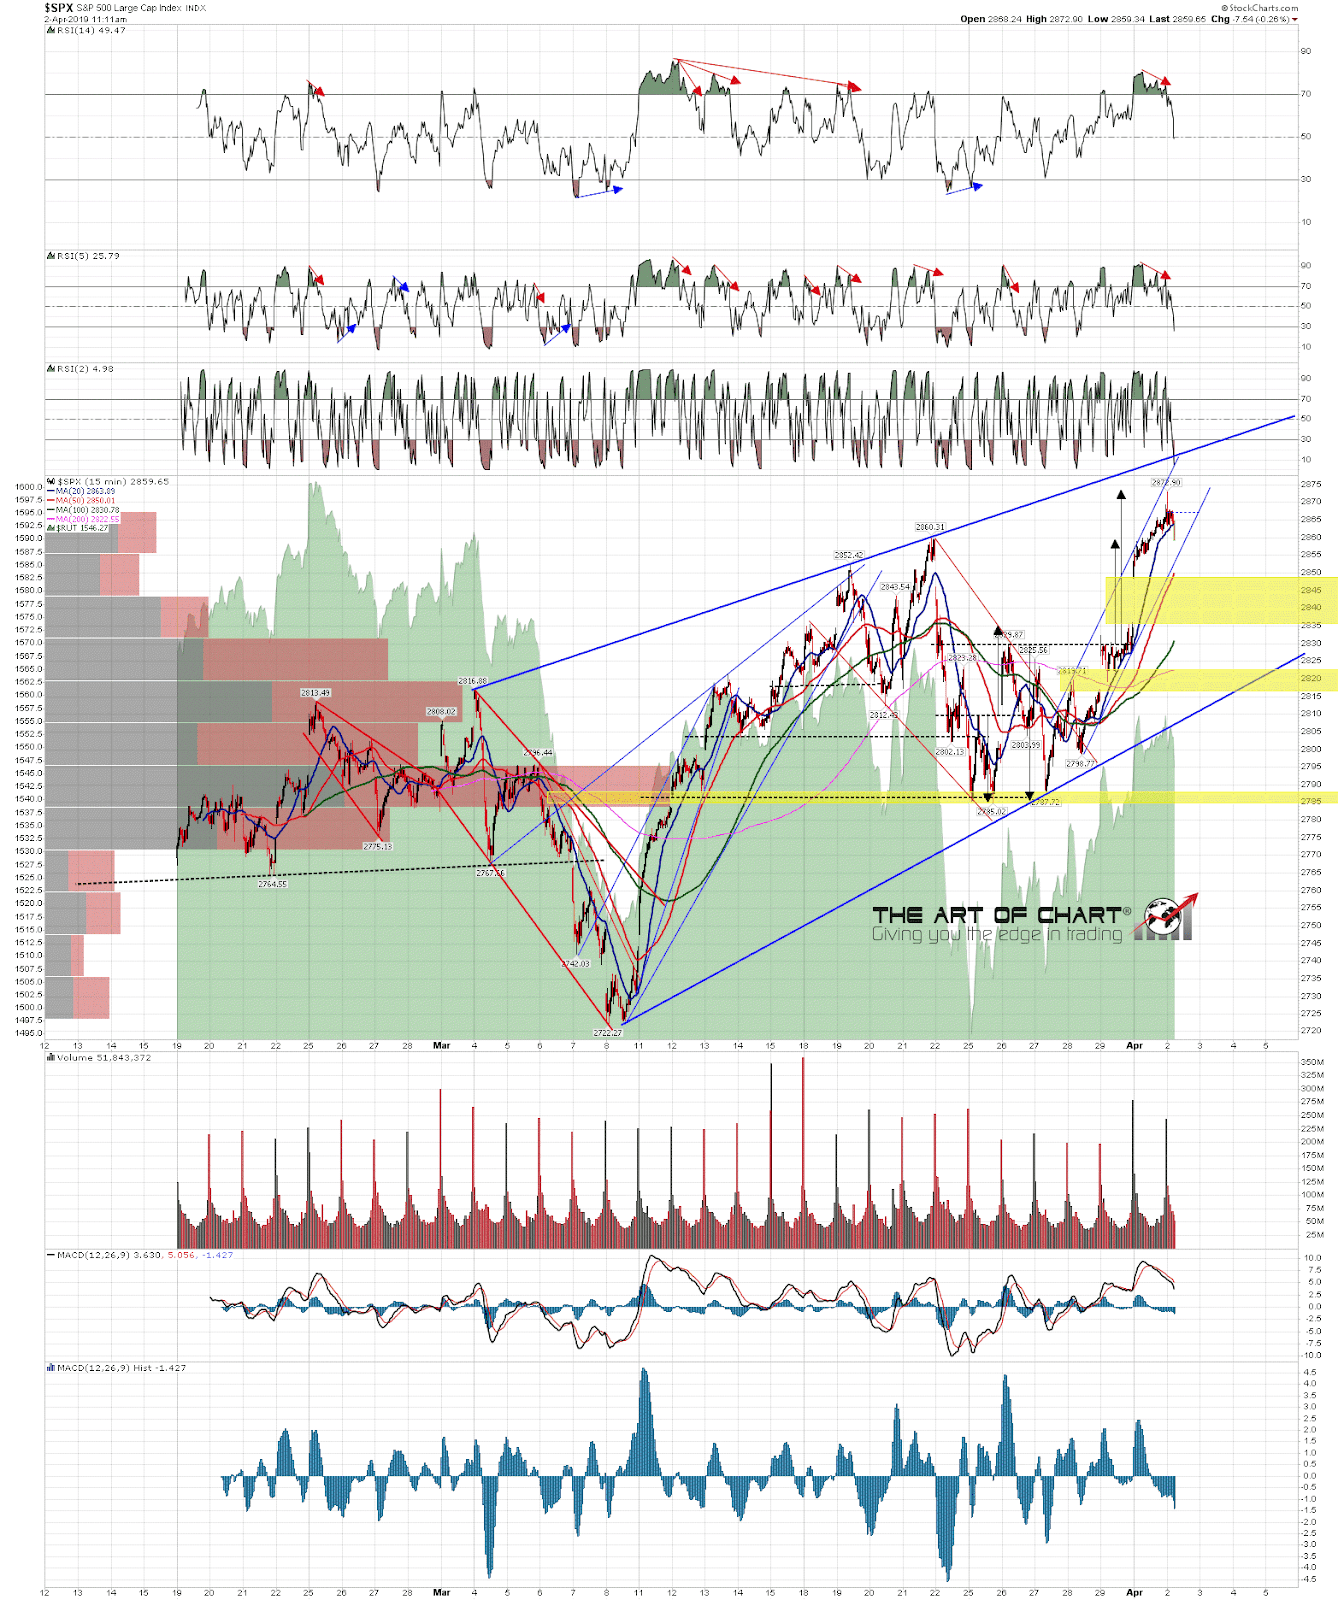
The 15min RSI 5 sell signal on SPX has now reached target but the RSI 14 sell signal is still open and I’m expecting to see at least some more downside even if this is just a retracement. The ideal rising wedge resistance trendlines on these SPX charts are both currently in the 2890 area and the wedge on the SPX 15min chart below is a lower degree wedge part of the larger wedge on the SPX hourly chart above. Stan has also identified this area as a fibonacci target area. We shall see.
SPX 15min chart:
We delayed the Trading Commodities (Setups and approaches) webinar that we were going to do an hour after the close last Wednesday to an hour after the close tomorrow. If you’d like to attend then you can register for that on our April Free Webinars. We are also doing our monthly free public Chart Chat on Sunday and you can register for that on the same page.
 02nd Apr 2019