On Tuesday I was looking at the obvious resistance trendlines on SPX that might be hit this week in the 2885-2900 area and I’ve been watching those since. This morning they have been hit at 2891/2 with a possible hourly RSI 14 sell signal brewing, so this is an important inflection point and possible swing high area. I talked about that before the open this morning and this is the full version below of my premarket video also covering the usual wide array of future and forex instruments.
Full Premarket Video from theartofchart.net – Updates on ES, NQ, RTY, DAX, ESTX50, SPX, NDX, RUT, CL, NG, GC, SI, HG, ZB, KC, SB, CC, ZW, ZC, ZS, DX, EURUSD, USDJPY, USDCAD, AUDUSD:
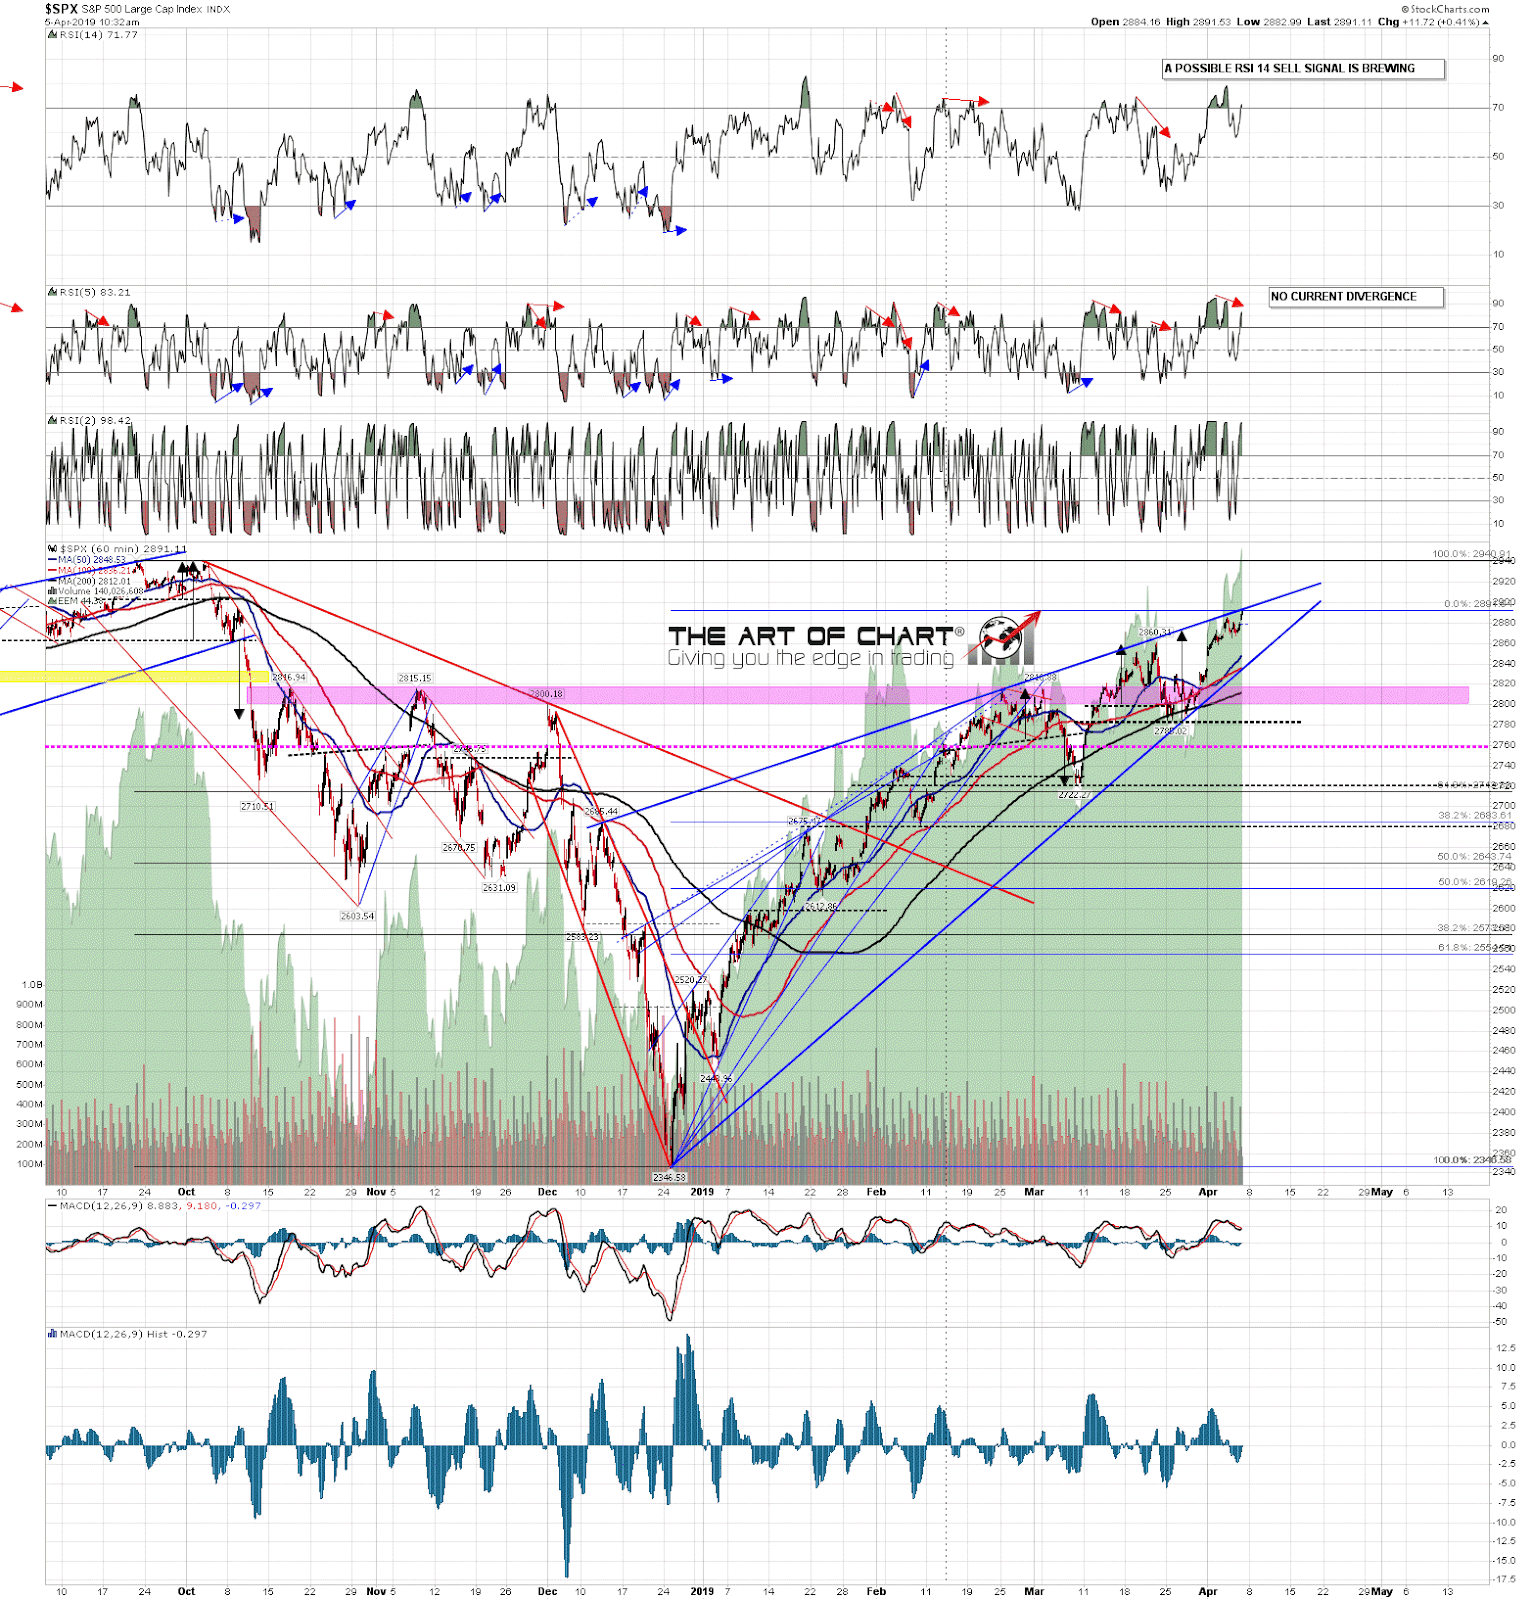
On the 60min chart the rising wedge resistance hit is pattern resistance for the move up from the December low. We currently have a precise hit of the trendline but there is always a possibility of a bearish overthrow of course, so SPX could go a little higher. SPX 60min chart:
The hit on the smaller rising wedge resistance trendline from the 2722 low is equally precise, but equally could overthrow. SPX 15min chart:
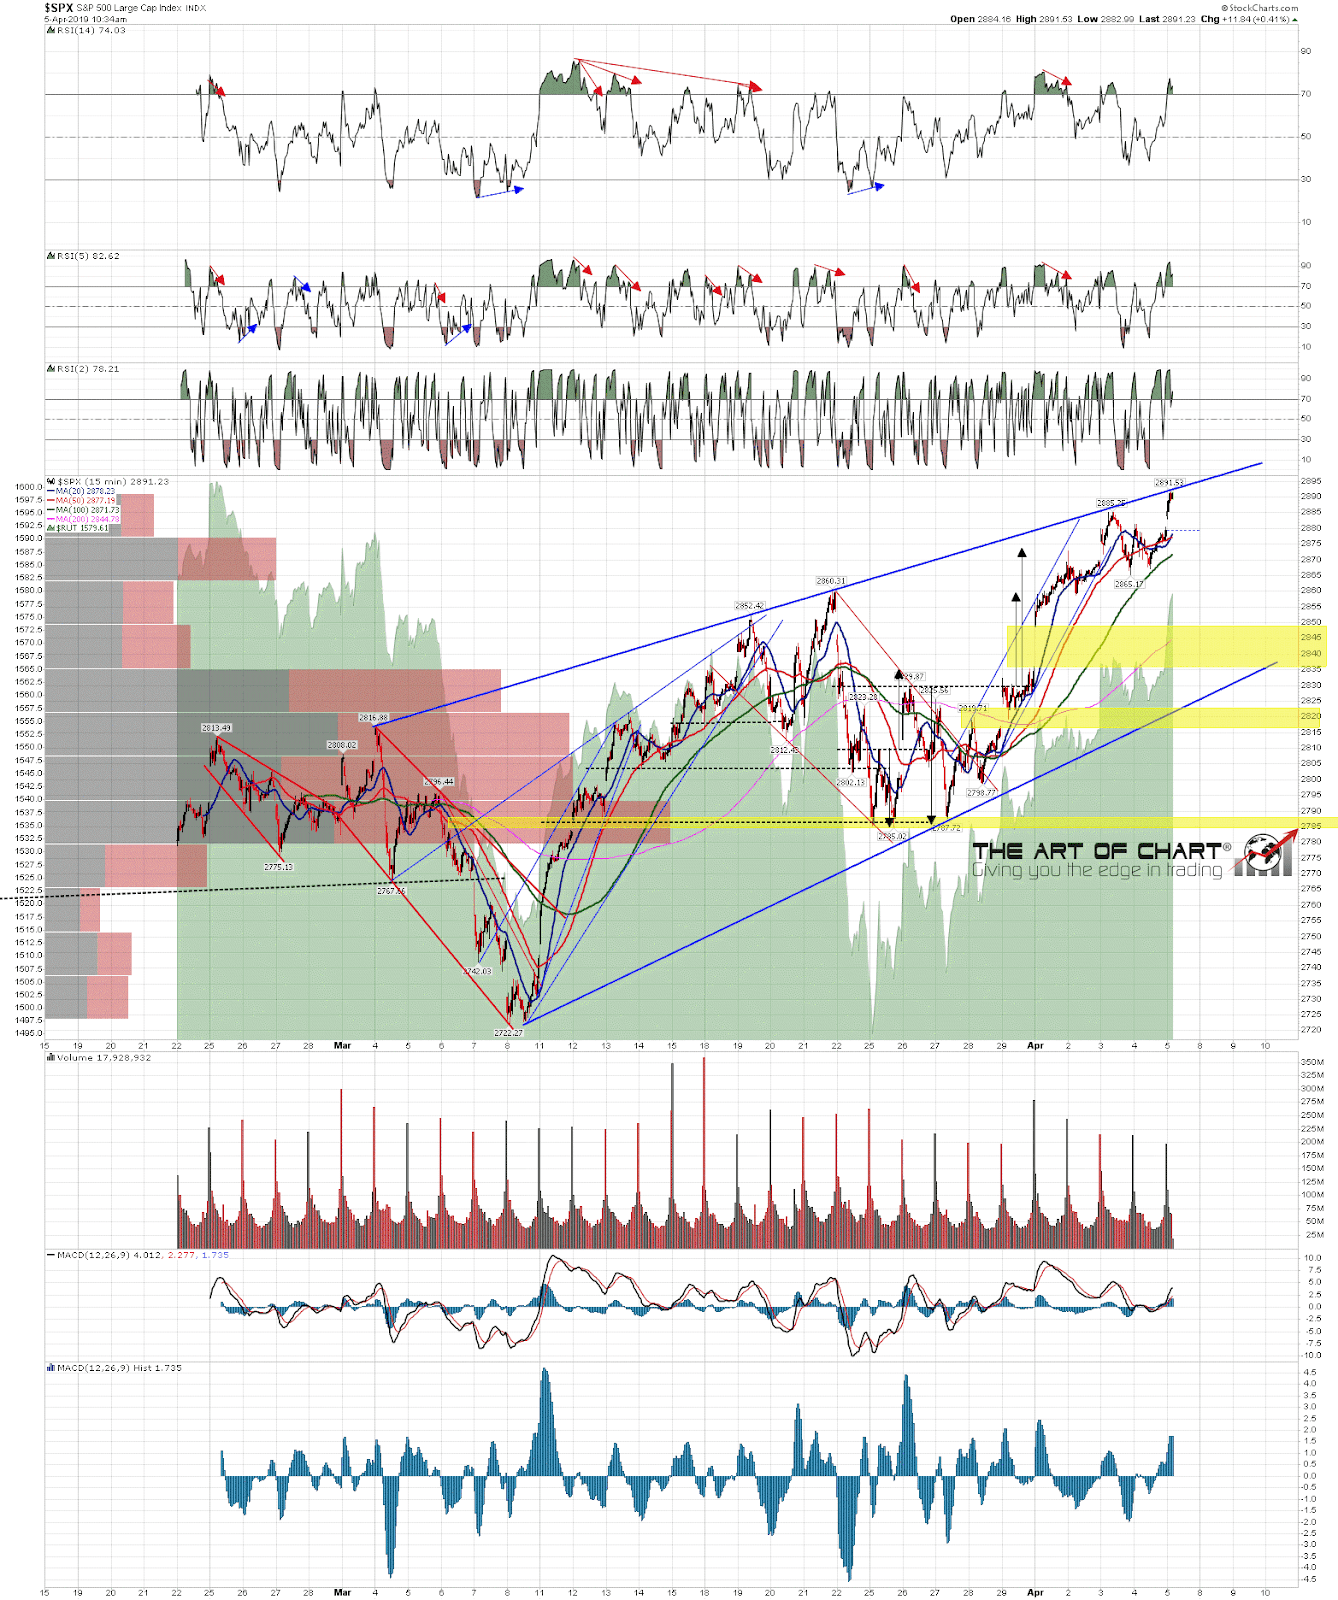
In terms of negative divergence there are already SPX daily (weak) RSI 14, hourly RSI 5 and 15min RSI 14 sell signals fixed, with possible weekly RSI 5, hourly RSI 14 and 5min RSI 14 sell signals brewing here. This would be a great place to see the turn. We shall see. 🙂
Stan and I are doing our monthly free public Chart Chat on Sunday afternoon. If you’d like to attend you can register for that on our April Free Webinars page. Everyone have a great weekend!
 05th Apr 2019