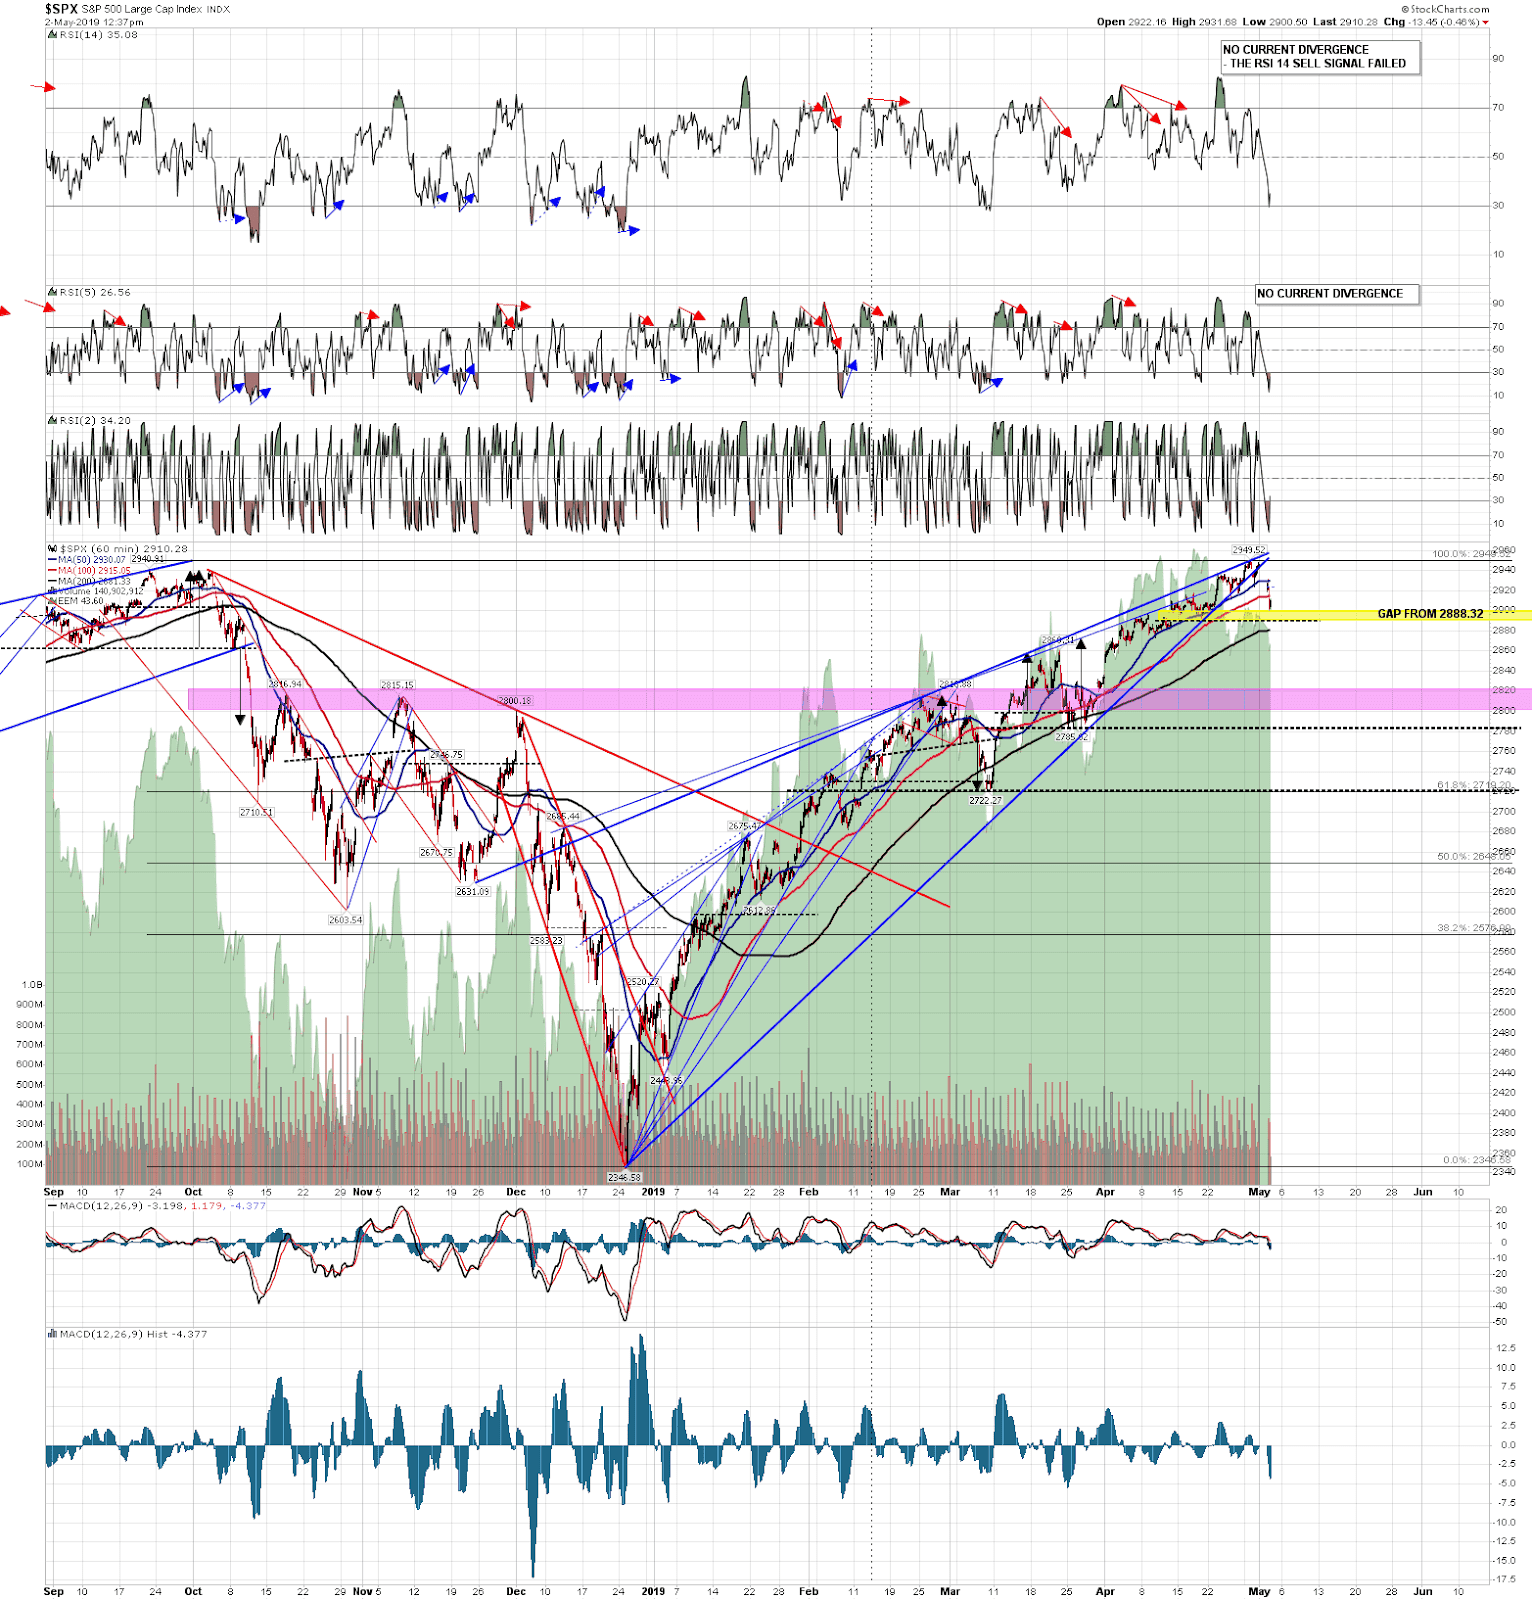
Since my post a week ago SPX has retested the all time high as expected and made a marginal higher high, the rising wedge from the December low has broken down, the second daily RSI 5 sell signal since the December low has fixed, the first having played out into the March low, SPX has broken important short term trend support at the 50 hour MA for the first time since March, and backtested that as resistance, and also broken the weekly pivot at 2925.
Today’s Premarket Video from theartofchart.net – Updates on ES, NQ, RTY, DAX, ESTX50, SPX, NDX, RUT, CL, NG, GC, SI, HG, ZB, DX, :
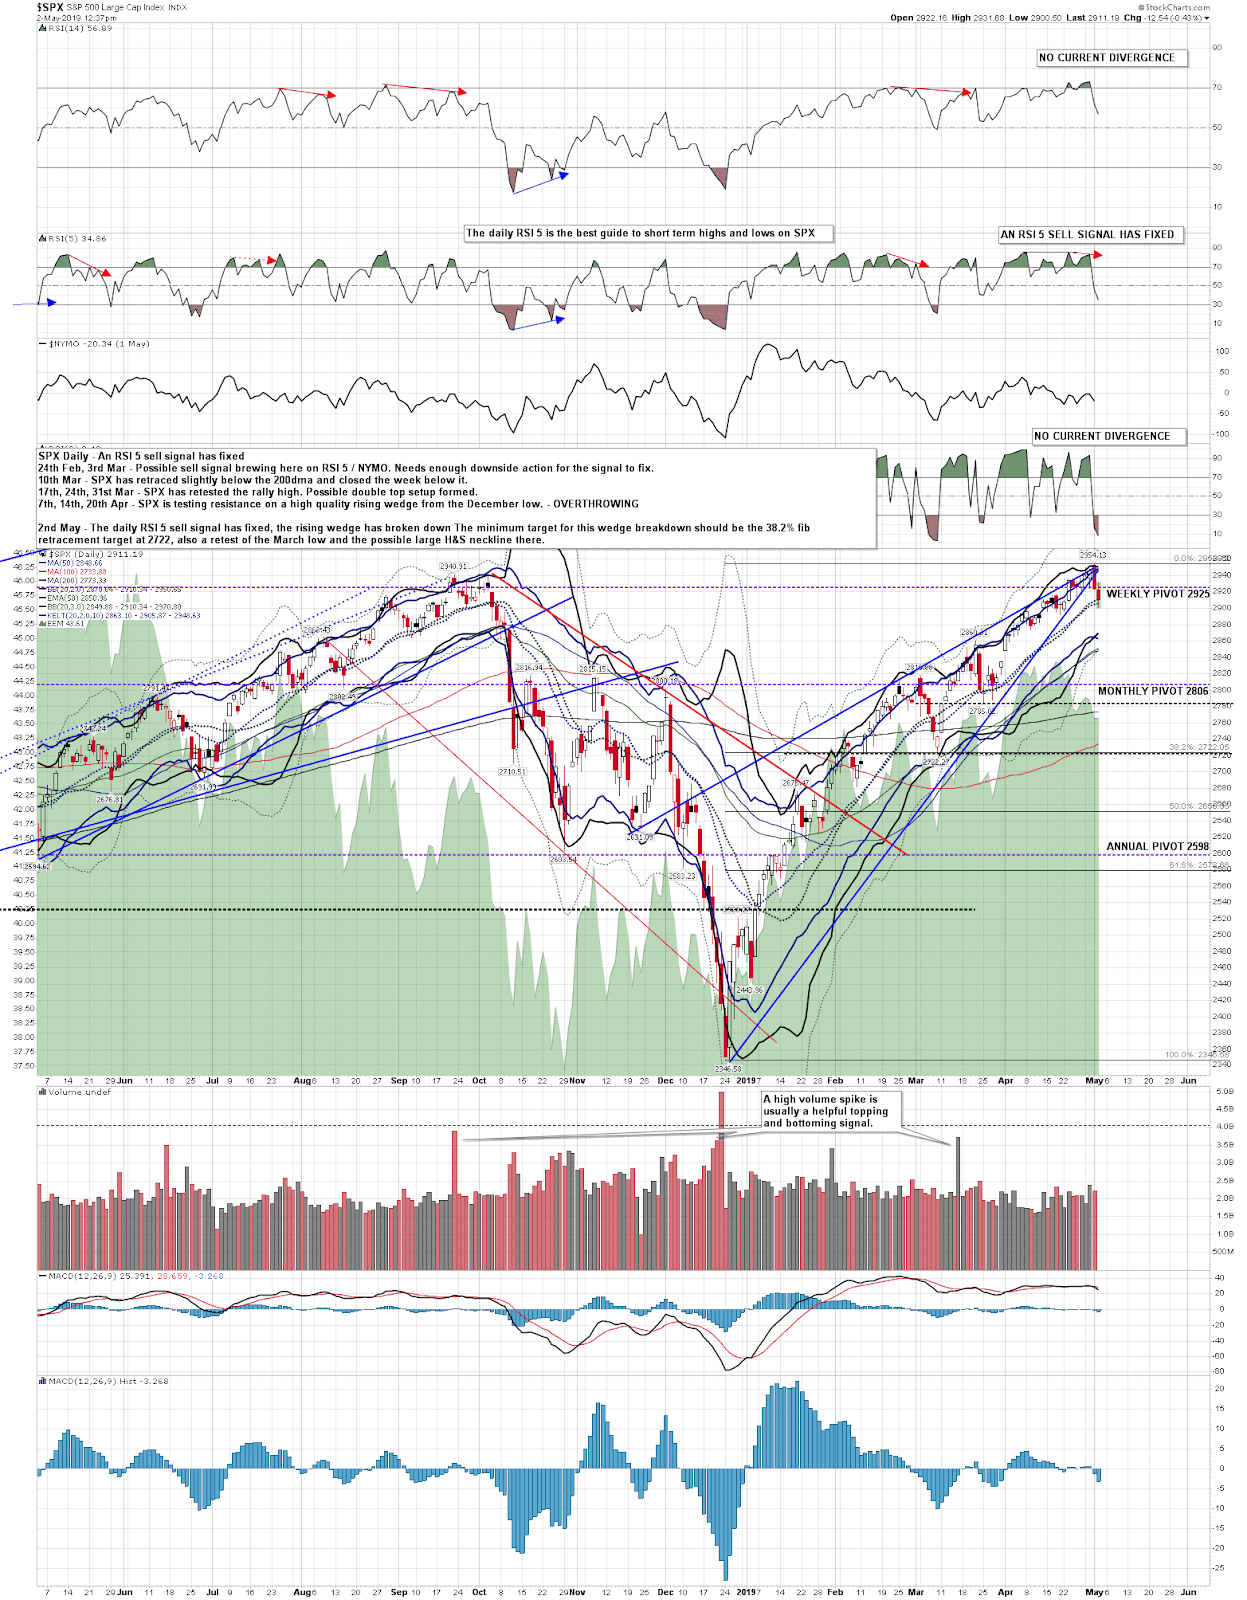
So what now, as we move into the next cycle low period expected in a couple of weeks? Well the minimum fibonacci retracement target I’m looking for on the breakdown of the wedge is the 38.2% target at 2722 which, if seen, would also be an exact retest of the March low and the possible large H&S neckline there. Ideally the next low would be there, with a right shoulder bounce back into (ideally) the 2868 area into the June cycle high window, though I have an alternate possibility for the May low in the 2820 area. That is assuming of course that shorter term support at the daily middle band, tested at the low today, can be broken.
SPX daily chart:
In the short term the hourly and daily sell signals are close to played out and we could see a rally here. Ideally the 50 hour MA, now at 2930 would hold as resistance as it did at the AM high today, and SPX would continue down from there. A sustained break back over 2930 could deliver yet another high retest, which would be annoying, but might of course be needed to set up a double top to deliver the next leg down.
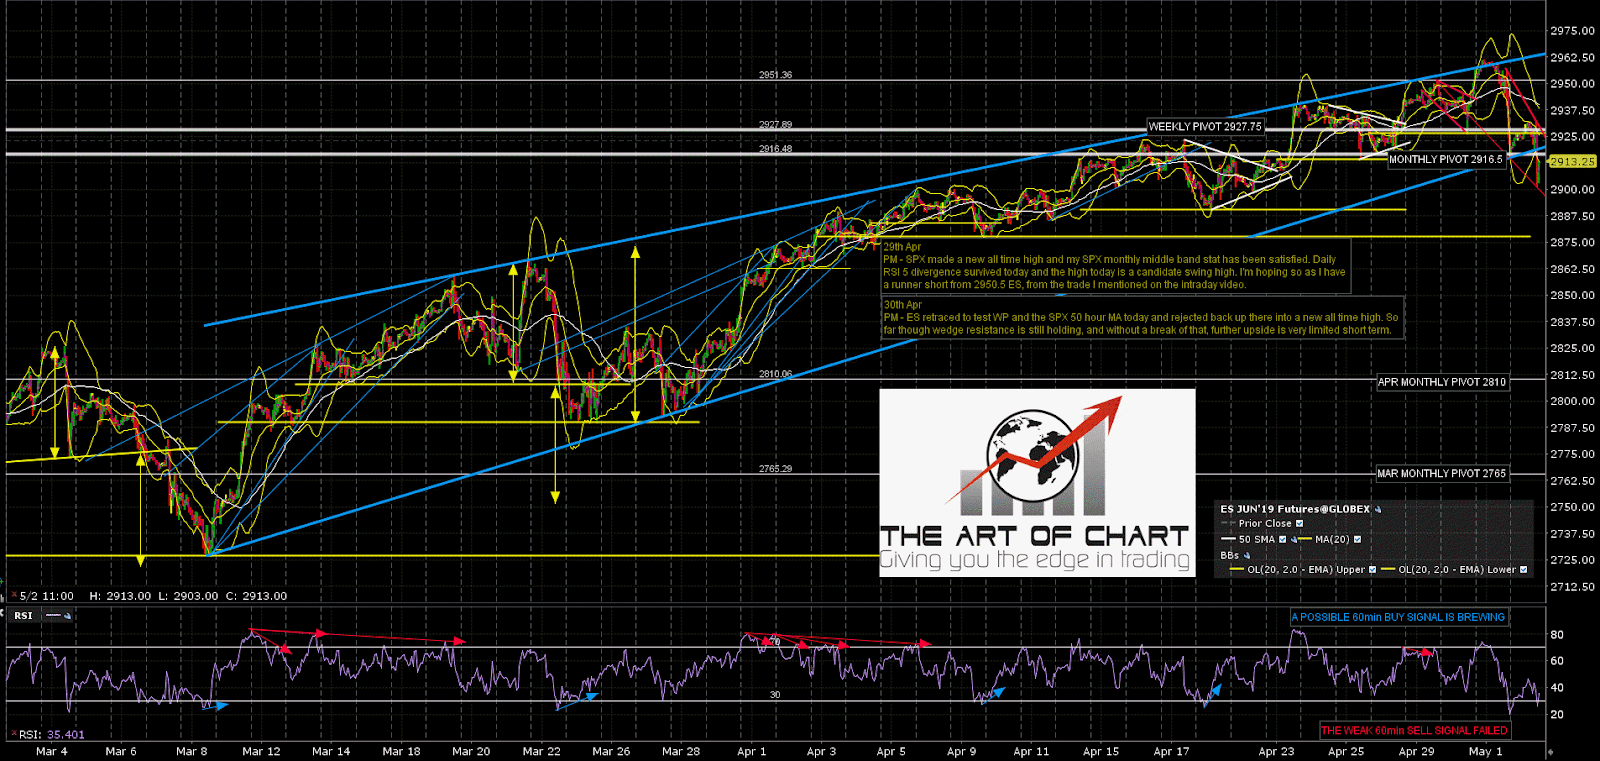
SPX 60min chart:
If we do see a sustained rally from the low this morning, I do have a possible ES 60min buy signal brewing to help deliver that high retest. We will see.
ES Jun 60min chart:
Stan and I are doing our monthly free public Chart Chat on Sunday looking at the usual very wide range of instruments across indices, bonds, metals, energies, currencies, cryptos and other commodities. If you’d like to attend you can register for that on our May Free Webinars page.
 02nd May 2019