I was talking about mean reversion in my post at the weekend and that was well timed, with the first spike down on Monday. The daily RSI 5 sell signal fixed and reached target and there was the first sustained break under the SPX 50 hour MA since the cross back above that in the 2920 area. So far, so good.
Now the more impatient of our trader brethren are always looking for a first sign of weakness to be followed by a wagnerian twilight of the gods with SPX falling like a rock and blood running in the streets, but in practical terms that is pretty rare, and there’s no reason to expect that here, as even if we pull more than 20% into April in a technical bear market, as I think we might well, I’d expect that to just be a technical retracement on the bigger picture before higher highs.
I’ve looked back through the SPX data as far as that goes back and 70%+ of all significant highs and lows on SPX are some kind of double top or bottom. The decline we saw this week on SPX is what I would describe as the low before the high, a sort of warm-up spike down before the more serious high is made, and that is generally followed by a retest and new high, which I’m expecting to see next week.
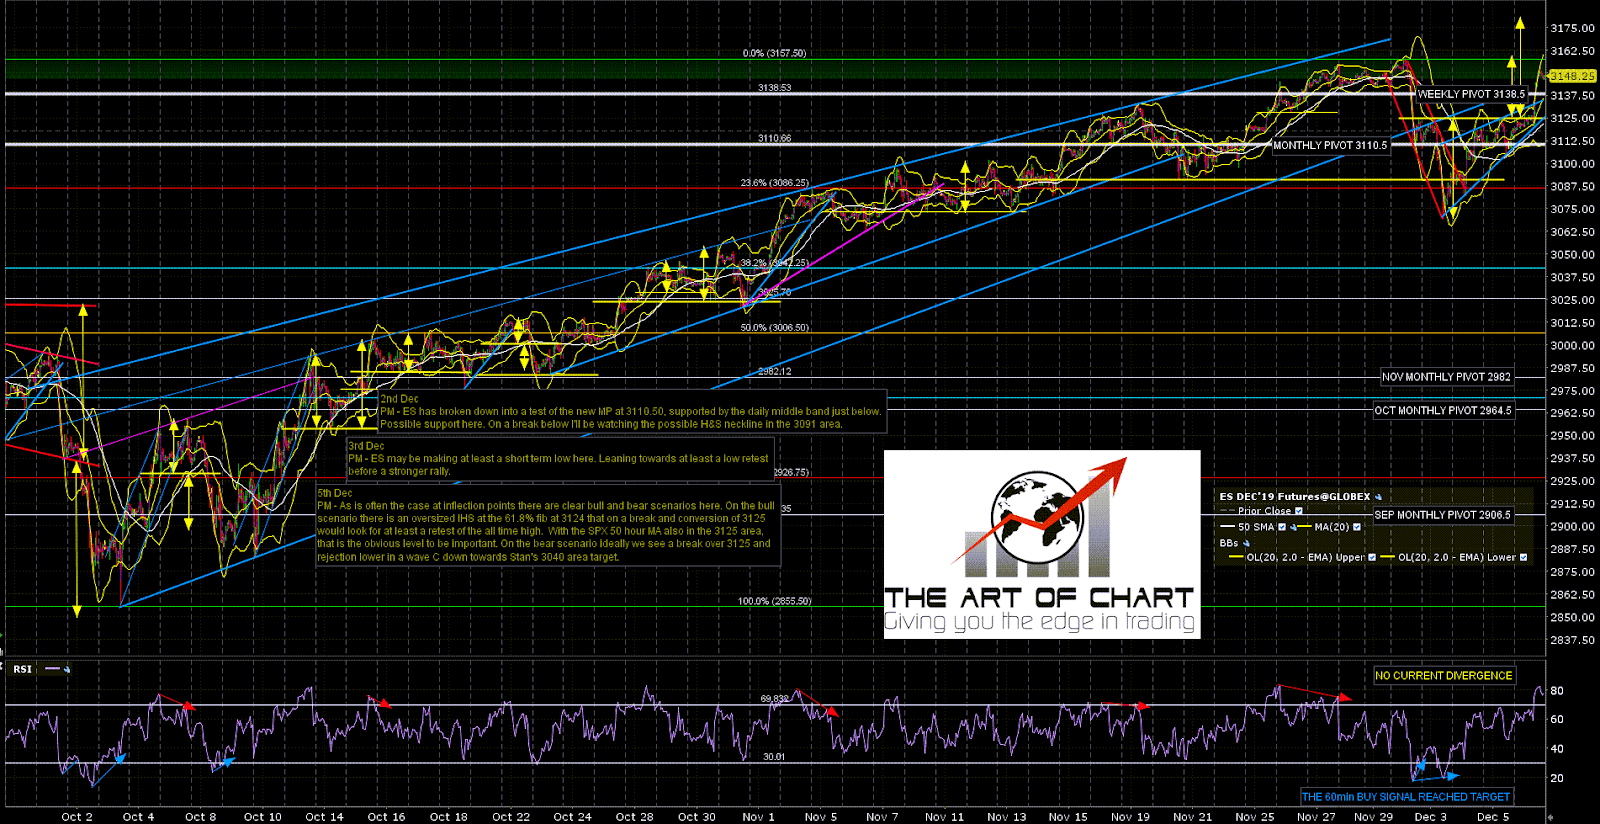
On my subscriber chart last night I drew the setup on ES as an IHS which would likely break up over 3125 last night or this morning and then either run the bull scenario into a minimum all time high retest, or fail after the break into a lower low, after which we’d likely make the same all time high retest from lower down. ES has obviously gone with the bull option on this morning’s strong job numbers, and the minimum IHS target is a retest of the all time high, with a possible extension target into the 3180 area.
ES Dec daily chart:
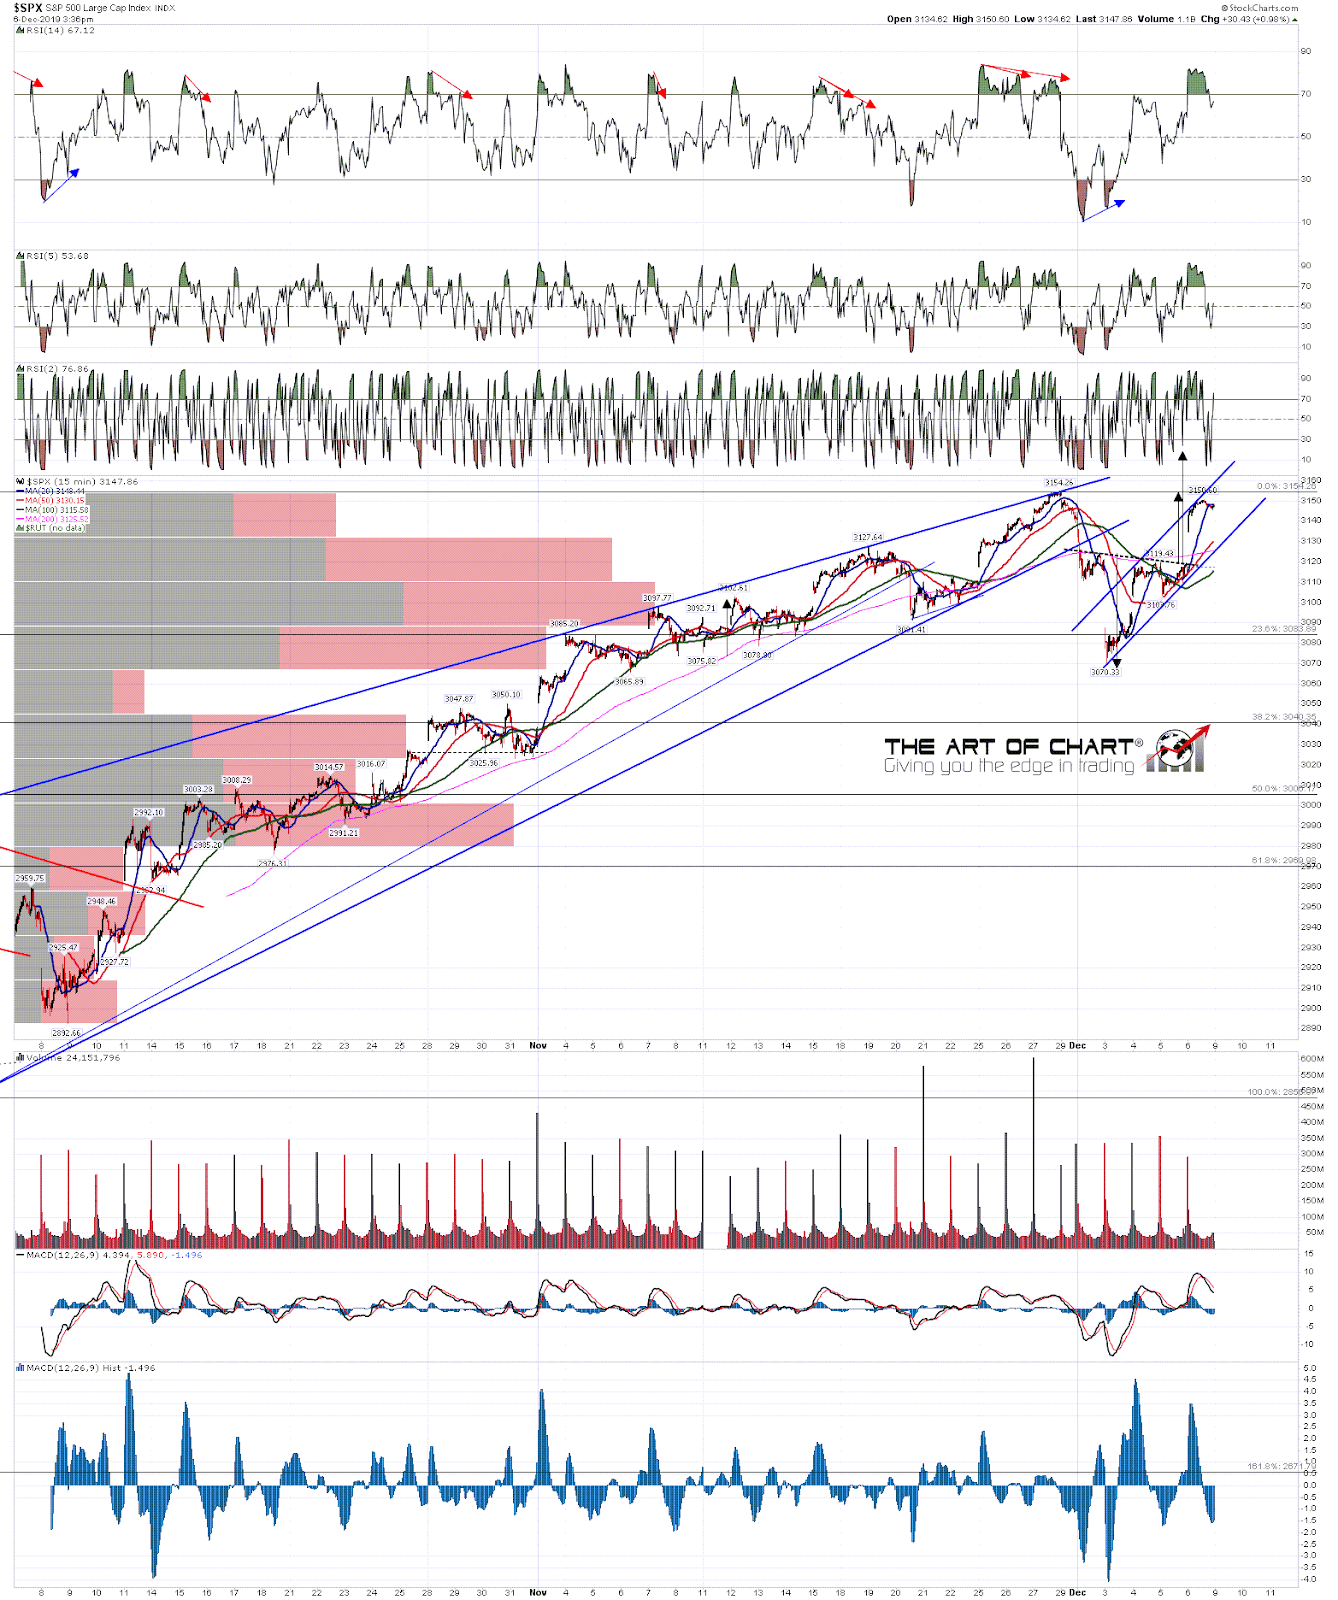
There’s a similar setup on the SPX 15min chart and the possible extension target there is in the 3175 area. These targets don’t have to be made, but often are. One other thing that I would note from this chart is that the move up from 3070 is within a tight rising channel, and I’d expect to see a test of that short term channel support earlyish next week:
SPX 15min chart:
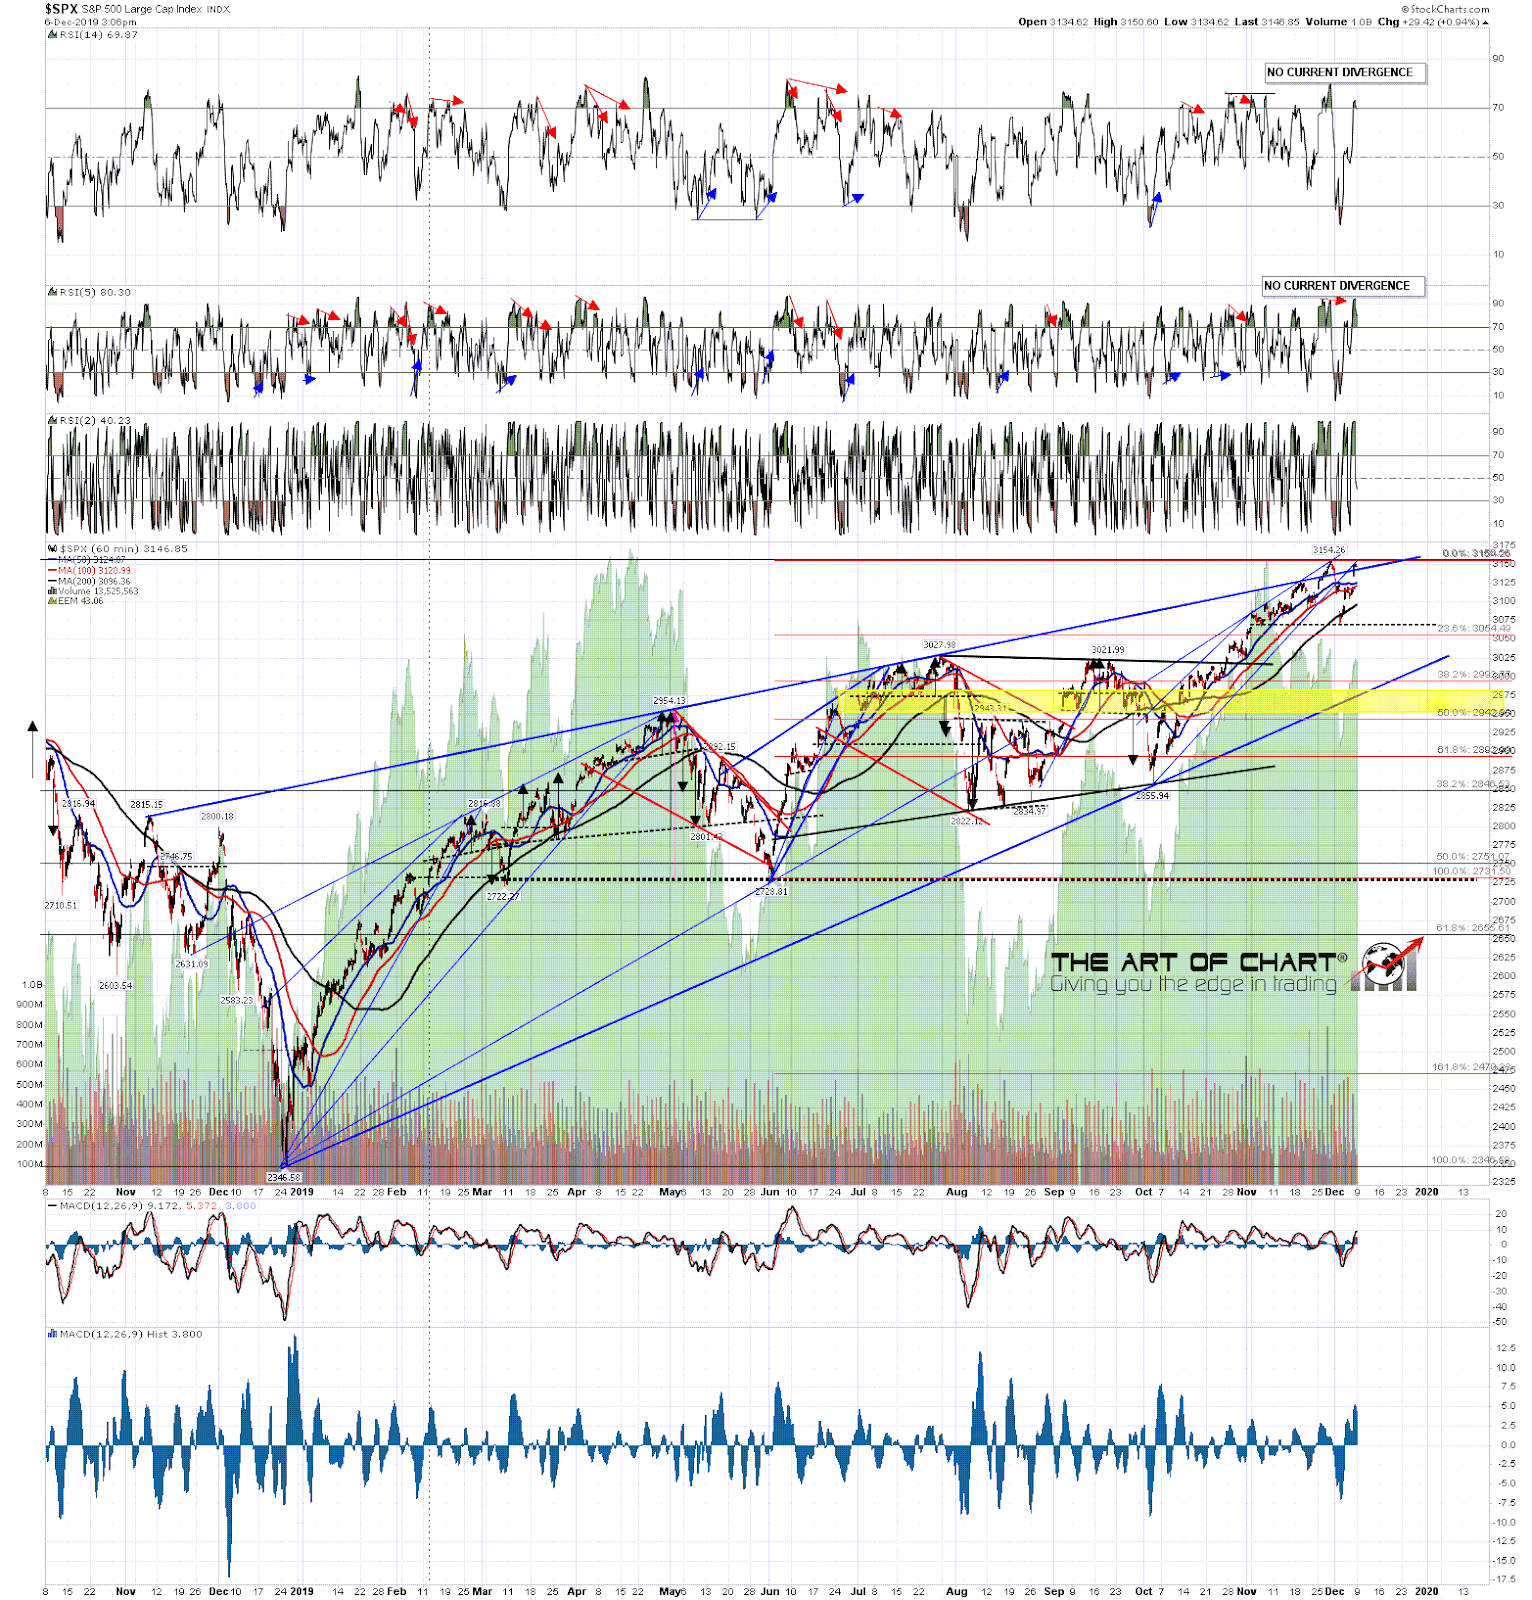
On the hourly chart I’m always talking about the importance the the 50 hour MA as short term trend support and resistance. That was resistance yesterday and SPX gapped over it at the open today. That will likely now be support until the next leg down has started. We should see negative RSI divergence on the hourly chart before than next move down begins.
SPX 60min chart:
On the daily chart as soon as the current all time high is retested a full possible RSI 14 daily sell signal will start brewing as well as a weekly RSI 5 sell signal. Those divergences will likely last into the next short term high and those sell signals should fix when the next leg down gets started. SPX daily chart:
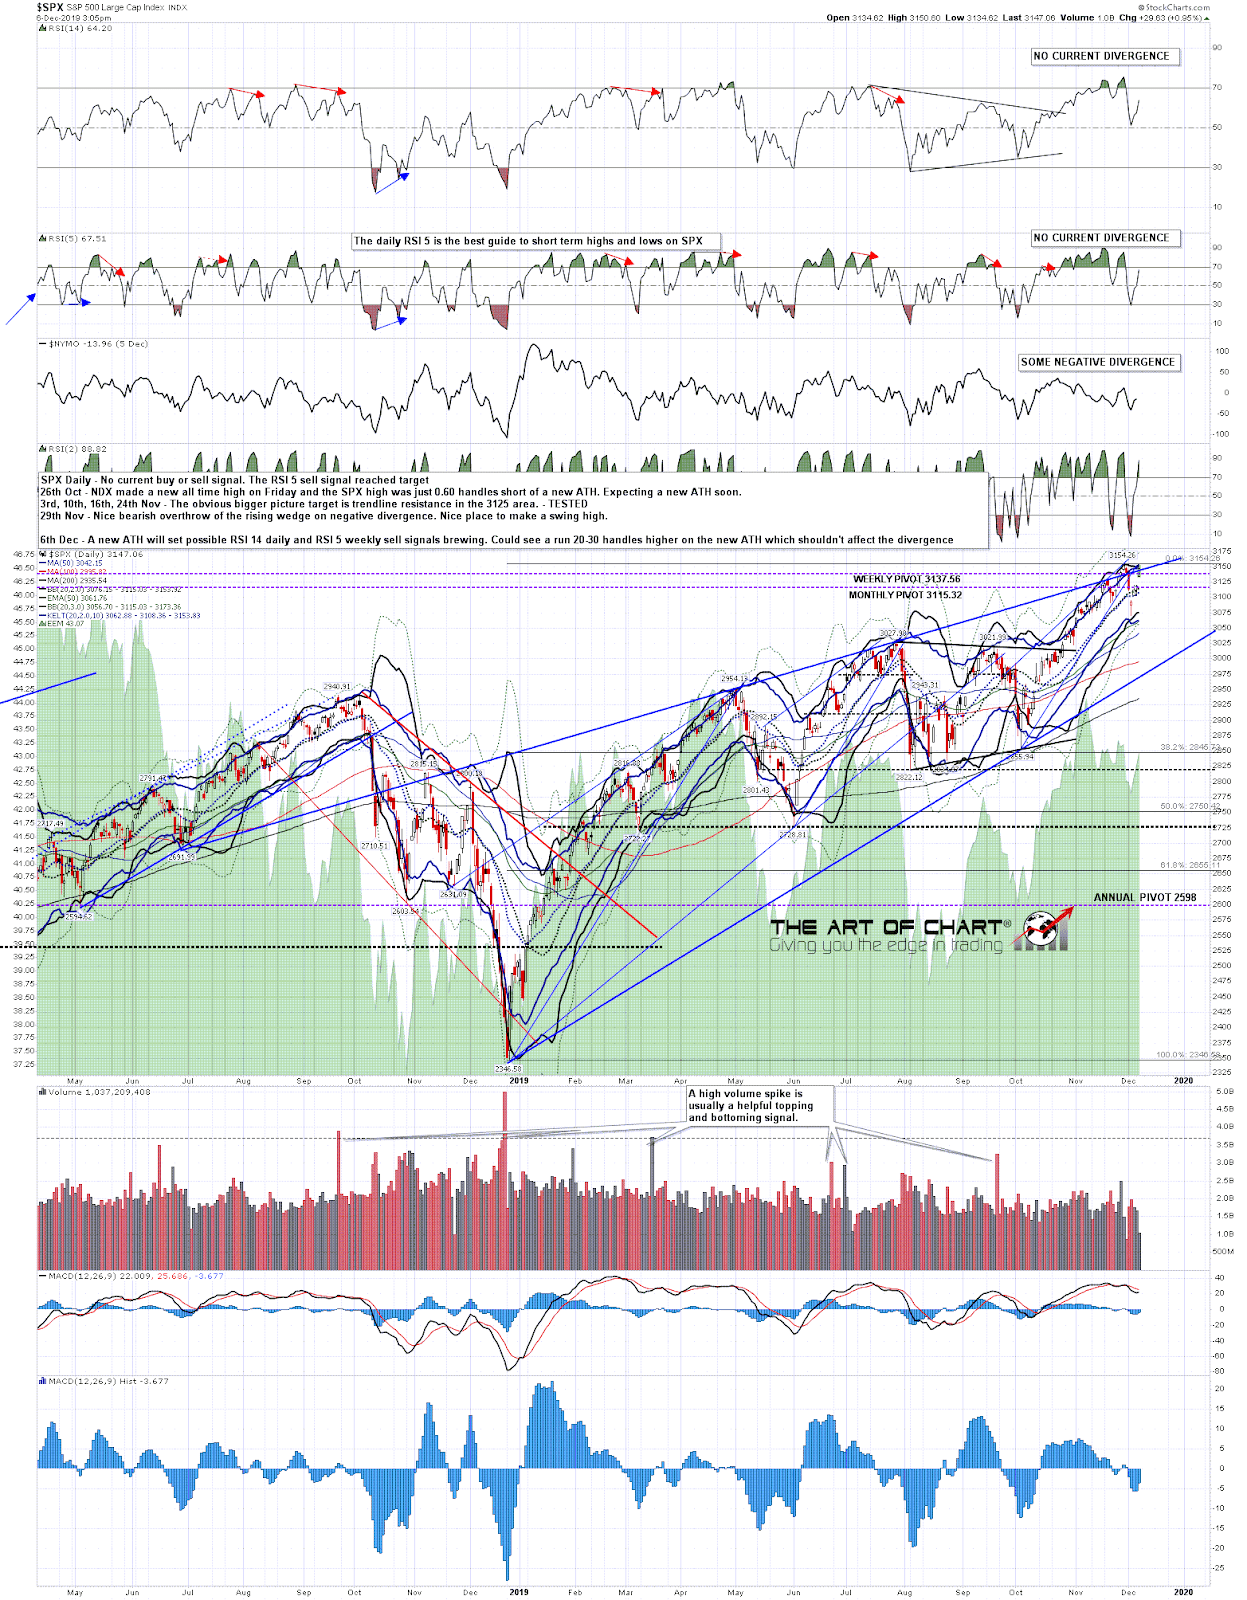
The minimum target for this move is satisfied as soon as the current all time high at 3154.26 is retested, but SPX may well run a bit higher. I mentioned the possible IHS extension targets in the 3170-80 area. I’d be surprised to see SPX much higher than that and it may well not get that far. We’ll see.
The monthly free public Chart Chat covering equity indices as well the usual wide range of other market and instruments on Sunday at 4pm EST and if you’d like to attend you can register for that at our December Free Webinars page. Everyone have a great weekend 🙂
 06th Dec 2019