
Apologies for the lack of a post last week. Some of you know my wife has some health issues at the moment and they have me distracted. I’m doing this post tonight because SPX is at a key inflection point and because the way this breaks may deliver the direction for the rest of January.
Before I start I have a quick announcement. We (theartofchart.net) have launched a new options service run by an old friend of the site Paul Frey. This is an educational service looking at options trade opportunities in real time run by a thirty year veteran of options trading. If your interested you can read about the service and access the free trial here.
Just to review the overall setup here, we have been looking for a reversal soon on this seemingly endless move up, and as I was noting in my last post, daily RSI 14 and RSI 5 sell signals have fixed on SPX, and a daily RSI 14 sell signal has also fixed on NDX, with a possible RSI 5 sell signal brewing too. These daily SPX RSI 5 / NYMO signals are very reliable so we were actively looking for the high.
SPX daily chart:
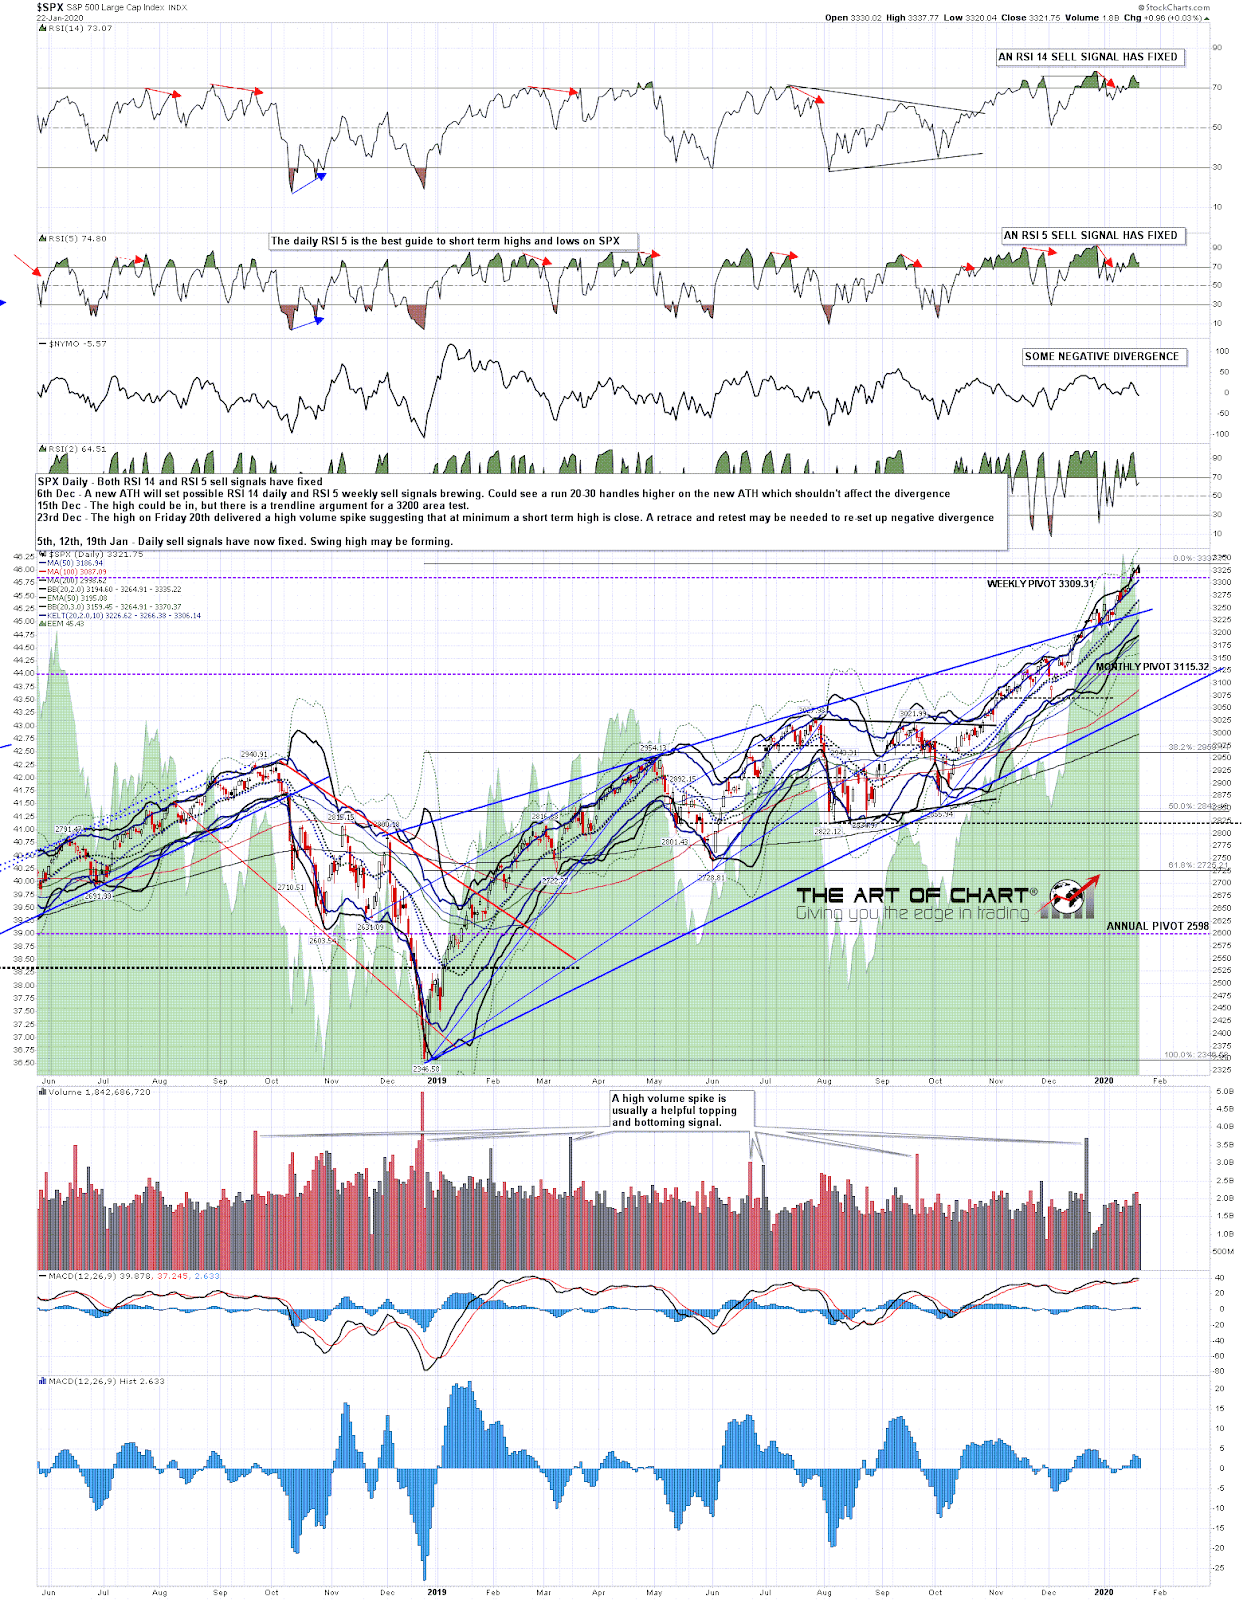
But then ……. there was a very interesting setup last week where it seemed that the perfect short term rising wedge from 3214.64 might break up, and I did a webinar that afternoon at that inflection point that I then posted on my twitter.
I was talking in that inflection point about the possibility that the rising wedge on SPX might break up with a target in the 3392 area and was talking about the very reliable performance of these patterns on the lower probability direction break, as long as after that break the broken wedge resistance trendline is respected as support.
Last week’s video:
I was saying in that webinar that wedges breaking against direction like this are fairly rare, though some of my longer term readers may recall the big one from the 2009 low that broke up on SPX a few years ago and made target, but on smaller timeframes where patterns form and play out a lot they are more common, and as it happens there was a very good example on the SPX intraday chart today.
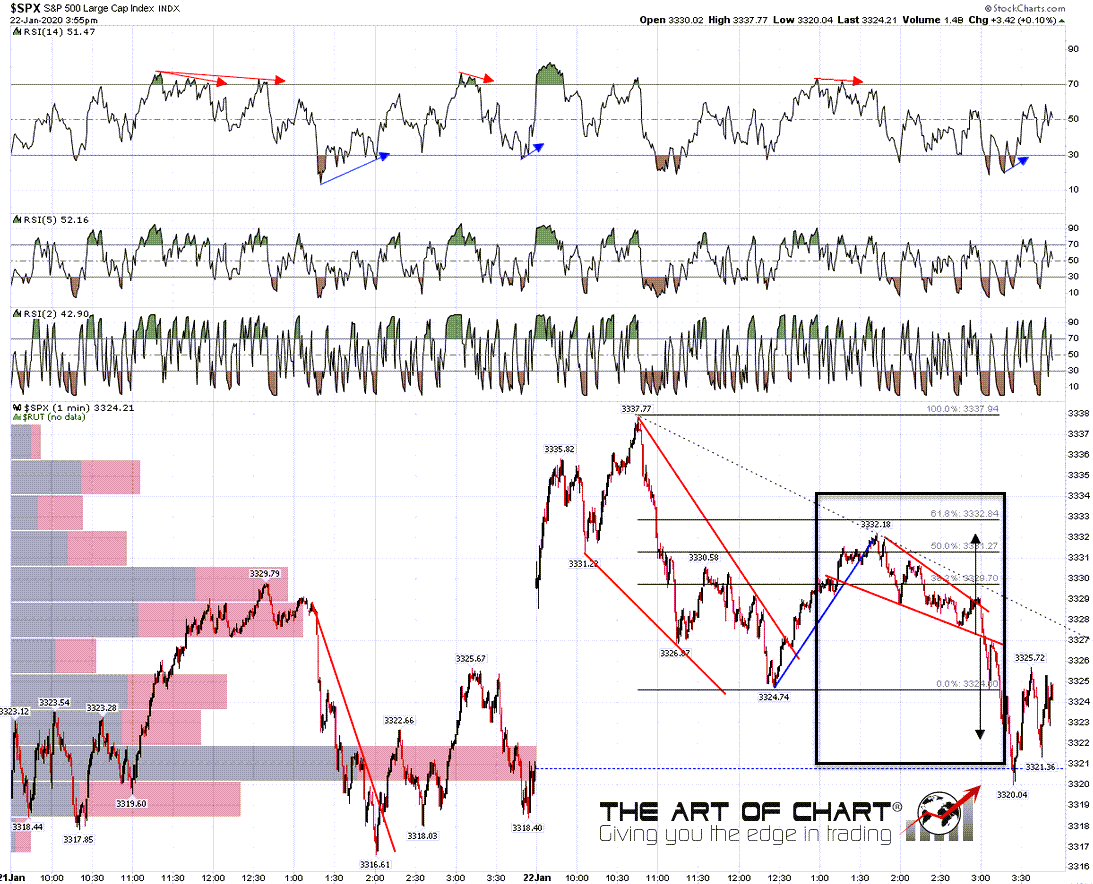
This example, on the SPX 1min chart below was a decent quality falling wedge (in the box) that broke up slightly in a bearish overthrow, and then broke down. There was a perfect backtest of broken wedge support and then a move to the pattern target shown with an arrow. This is an ideal example of what I was looking at in the video and a great inverted example of the larger pattern setup on SPX here.
SPX 1min chart from today:
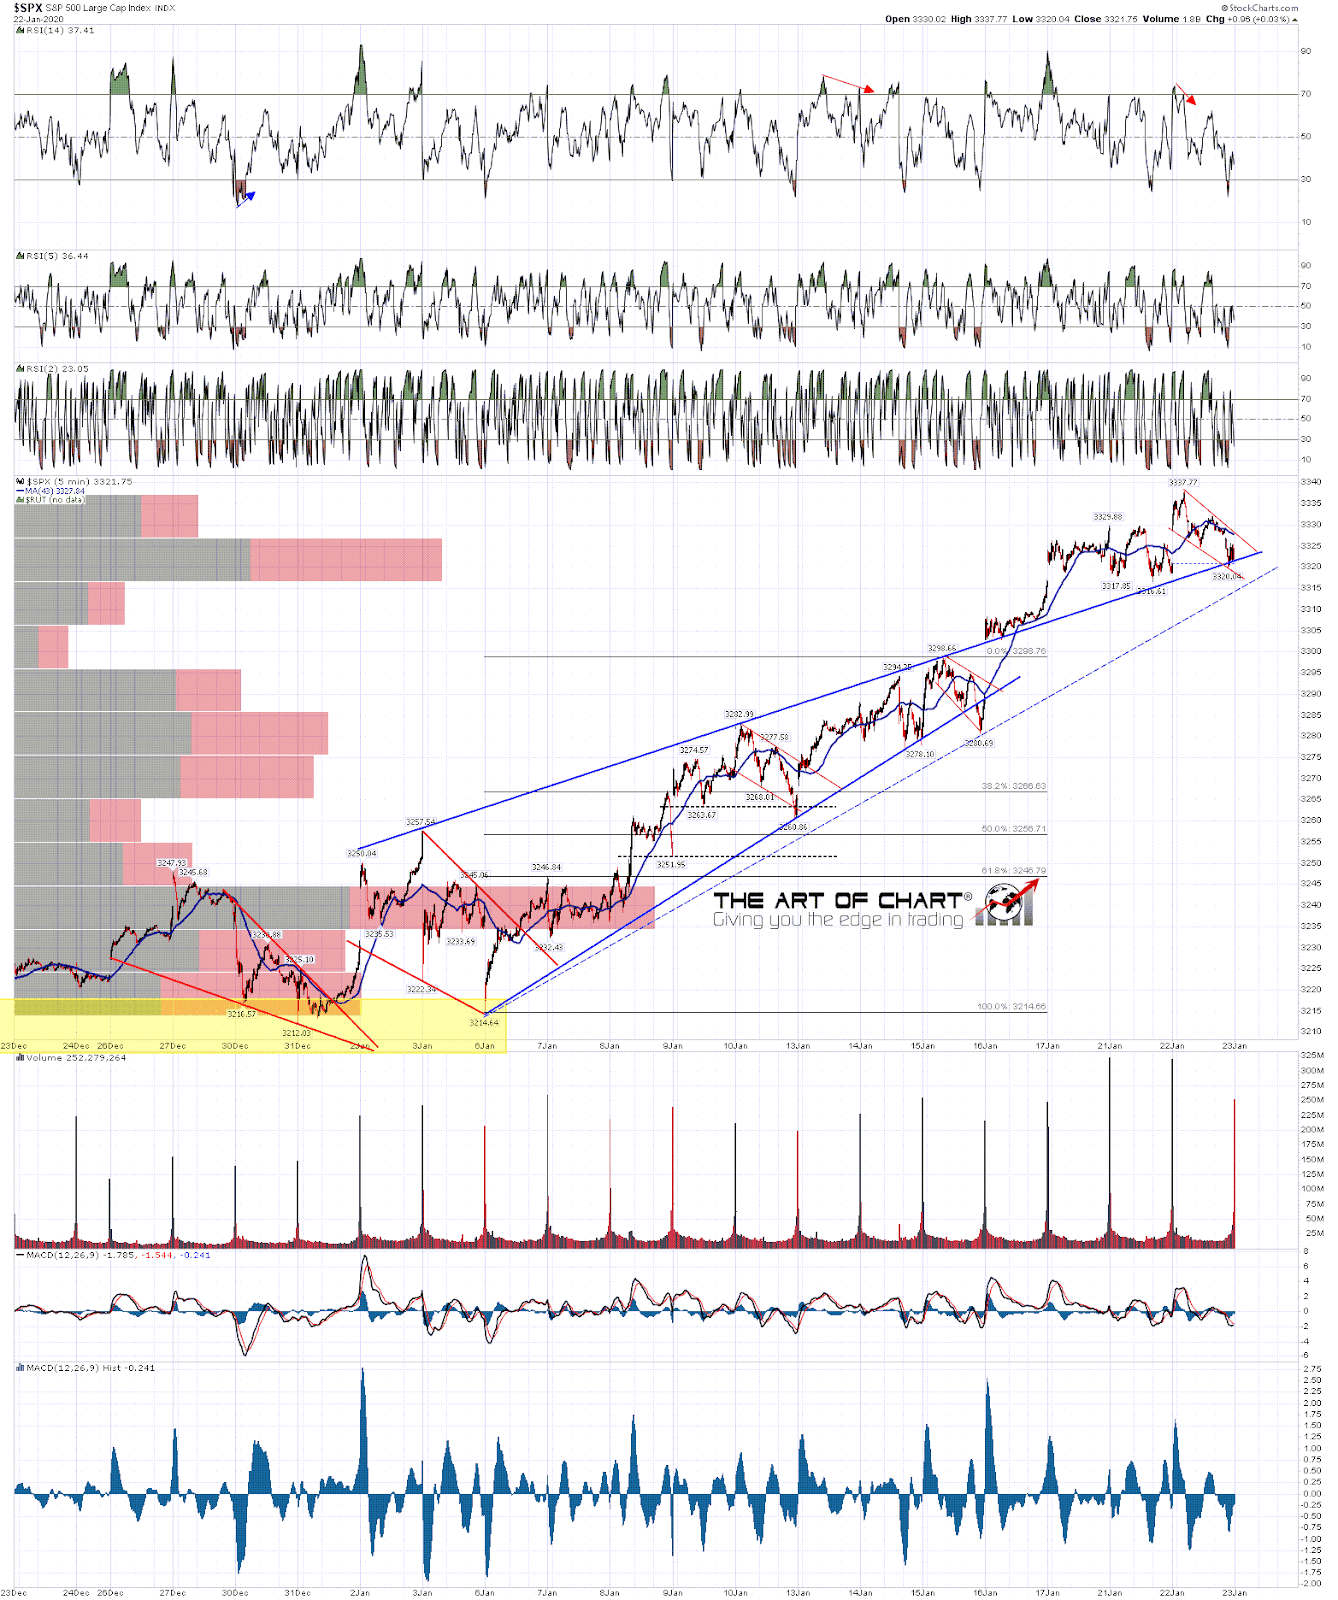
So that brings us to today’s inflection point on SPX, shown below on the 5min chart over the last month. The rising wedge broke up, backtested the broken wedge resistance trendline and then continued higher, but returned today to backtest broken wedge resistance again, closing just above it.
If SPX breaks back below that wedge resistance trendline then the 3392 wedge target is invalidated, and at that stage SPX and NDX are still on strong sell signals with a short term pattern outlook which will then be leaning bearish again. If instead ES recovers the ten handles or so lost since the RTH close today, then SPX holds the trendline as support and makes a new all time high, then that 3392 target will be looking pretty good.
We’ll see how that goes tomorrow but whichever way that break goes may well deliver the market direction for the rest of January, which is important as the January Barometer statistic I’ve been looking at actually delivers pretty well. I’ll be writing this up in detail in my next post at the weekend but the bottom line is that if January closes green, over the 2019 close at 3230.78, then the odds of SPX closing 2020 higher than that January close are about 87%, up from an average probability of an annual green close of about 73%. If January closes red, under the 2019 close at 3230.78, then the odds of a 2020 close lower than that January close are about 41%, up 50% from an average probability of an annual red close of 27%.
SPX 5min chart:
We’ll see how that goes in the morning, though I’ll be a bit late in so I’ll likely miss the RTH open.
 22nd Jan 2020