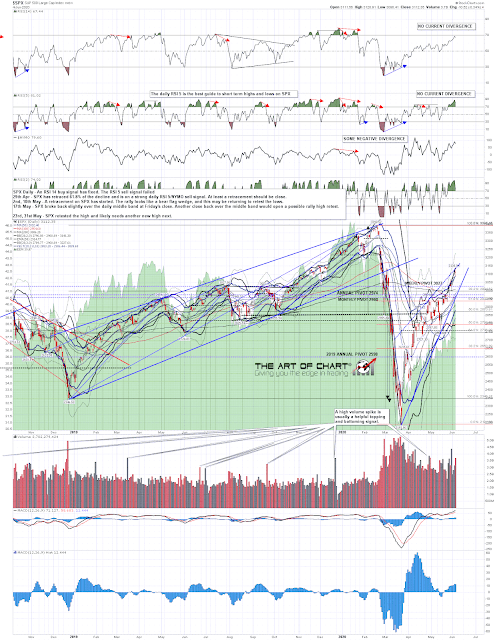
SPX made it to the 3100 area as expected, and a bit higher, and is now at the last big inflection point area before a retest of the all time highs. Why is this a big area? Well this is the last big fibonacci retracement level, and there are two significant high levels here, the first rally high after the all time high at 3136.72, and the November 2019 high at 3154.26 made on the move up to the all time high. A break over these levels is fine, but if 3154.26 is converted to support then that opens the way for a possible test of the all time high at 3393.52. That’s a real possibility now, but we should at least see a retracement from this area.
SPX daily chart:
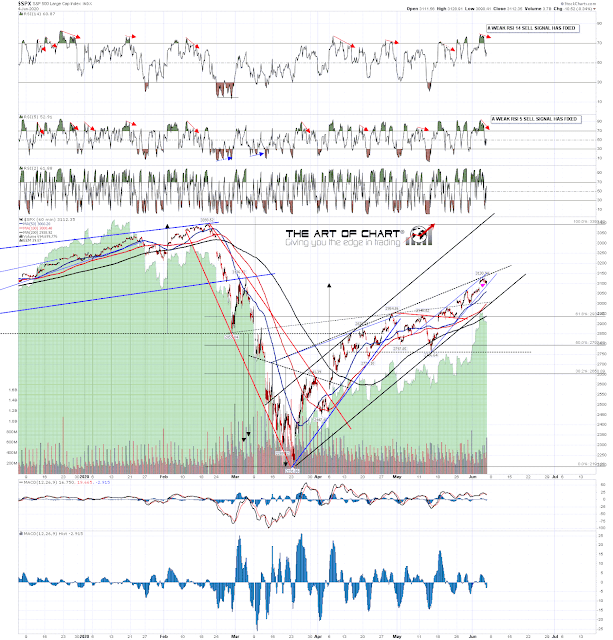
In terms of the SPX hourly chart, SPX has now arrived and is testing an ideal possible rising wedge resistance trendline. As this is a rising wedge that can overthrow at the high, but on a break below rising support, now in the 2980 area, we should at least see a decent retracement into established support in the 2760-70 area, close to the 38.2% retracement of the rally so far. A higher high on SPX today should set up a strong hourly RSI 14 negative divergence.
SPX 60min chart:
On the 15min chart the smaller rising wedge from that established support and specifically from the May low at 2766.64 is also looking good and the low yesterday was at that rising wedge support trendline.
SPX 15min chart:
The NDX chart is concerning me a bit here as NDX has been lagging SPX the last couple of weeks. The minimum target at the retest of the all time high has now been reached, but the ideal target at a test of rising megaphone resistance, now in the 10,150 has not yet been reached, and might need to be. Watching for signs of reversal.
NDX weekly chart:
Unless something really unexpected is happening SPX should be topping out here for at least a decent retracement. If that delivers the next big inflection point would likely be at the retest of the May low in the 2766 area. To set up that move might well require a decent initial retracement back into the 3000 area and then a retest of this high to set up negative RSI 14 divergence on the daily chart.
Stan and I are doing our monthly free public Chart Chat covering the usual wide range of markets and instruments at theartofchart.net on at 4pm EST Sunday. If you’d like to attend you can register for that here.


 05th Jun 2020