It has been a grim year and I, and many others, will be very glad to leave it behind, but even with maximum lockdown spreading rapidly across the UK with the new virus mutation, I have a great holiday weekend planned with roaring fires, presents, great food, homemade pancakes, (probably too much) chocolate, board games and so on. My soon to be ex-wife will be absent but my three children, two cats, and one dog will all be here having a great time and there is a good chance that this will be the most enjoyable christmas that we have had so far this millenium. I’m really looking forward to it. I’ve had requests for a family video of us making pancakes over the holiday that I may well film on New Year’s Day and post on YouTube. 🙂
In the background of course markets are still trading and are setting up beautifully for a possible retracement in (probably) early January, so let’s have a quick look and see how that is developing.
On the Dow 30 price is still rising very gently just under the beautiful rising wedge resistance trendline that I’ve been watching for four or five weeks now. Looking for a retracement towards rising wedge support, currently in the 28000 area, to start soon. No bearish overthrow here so that wedge support may well hold as support when tested.
INDU 60min chart: 
On the SPX chart I had SPX bearishly overthrowing my initial rising wedge resistance trendline, but the latest all time high has established a high quality alternate wedge resistance trendline that I have switched over to now. This wedge is therefore in the same place as the Dow 30 wedge, looking for a retracement back to rising wedge support to start soon, with that currently in the 3470 area.
SPX 60min chart: 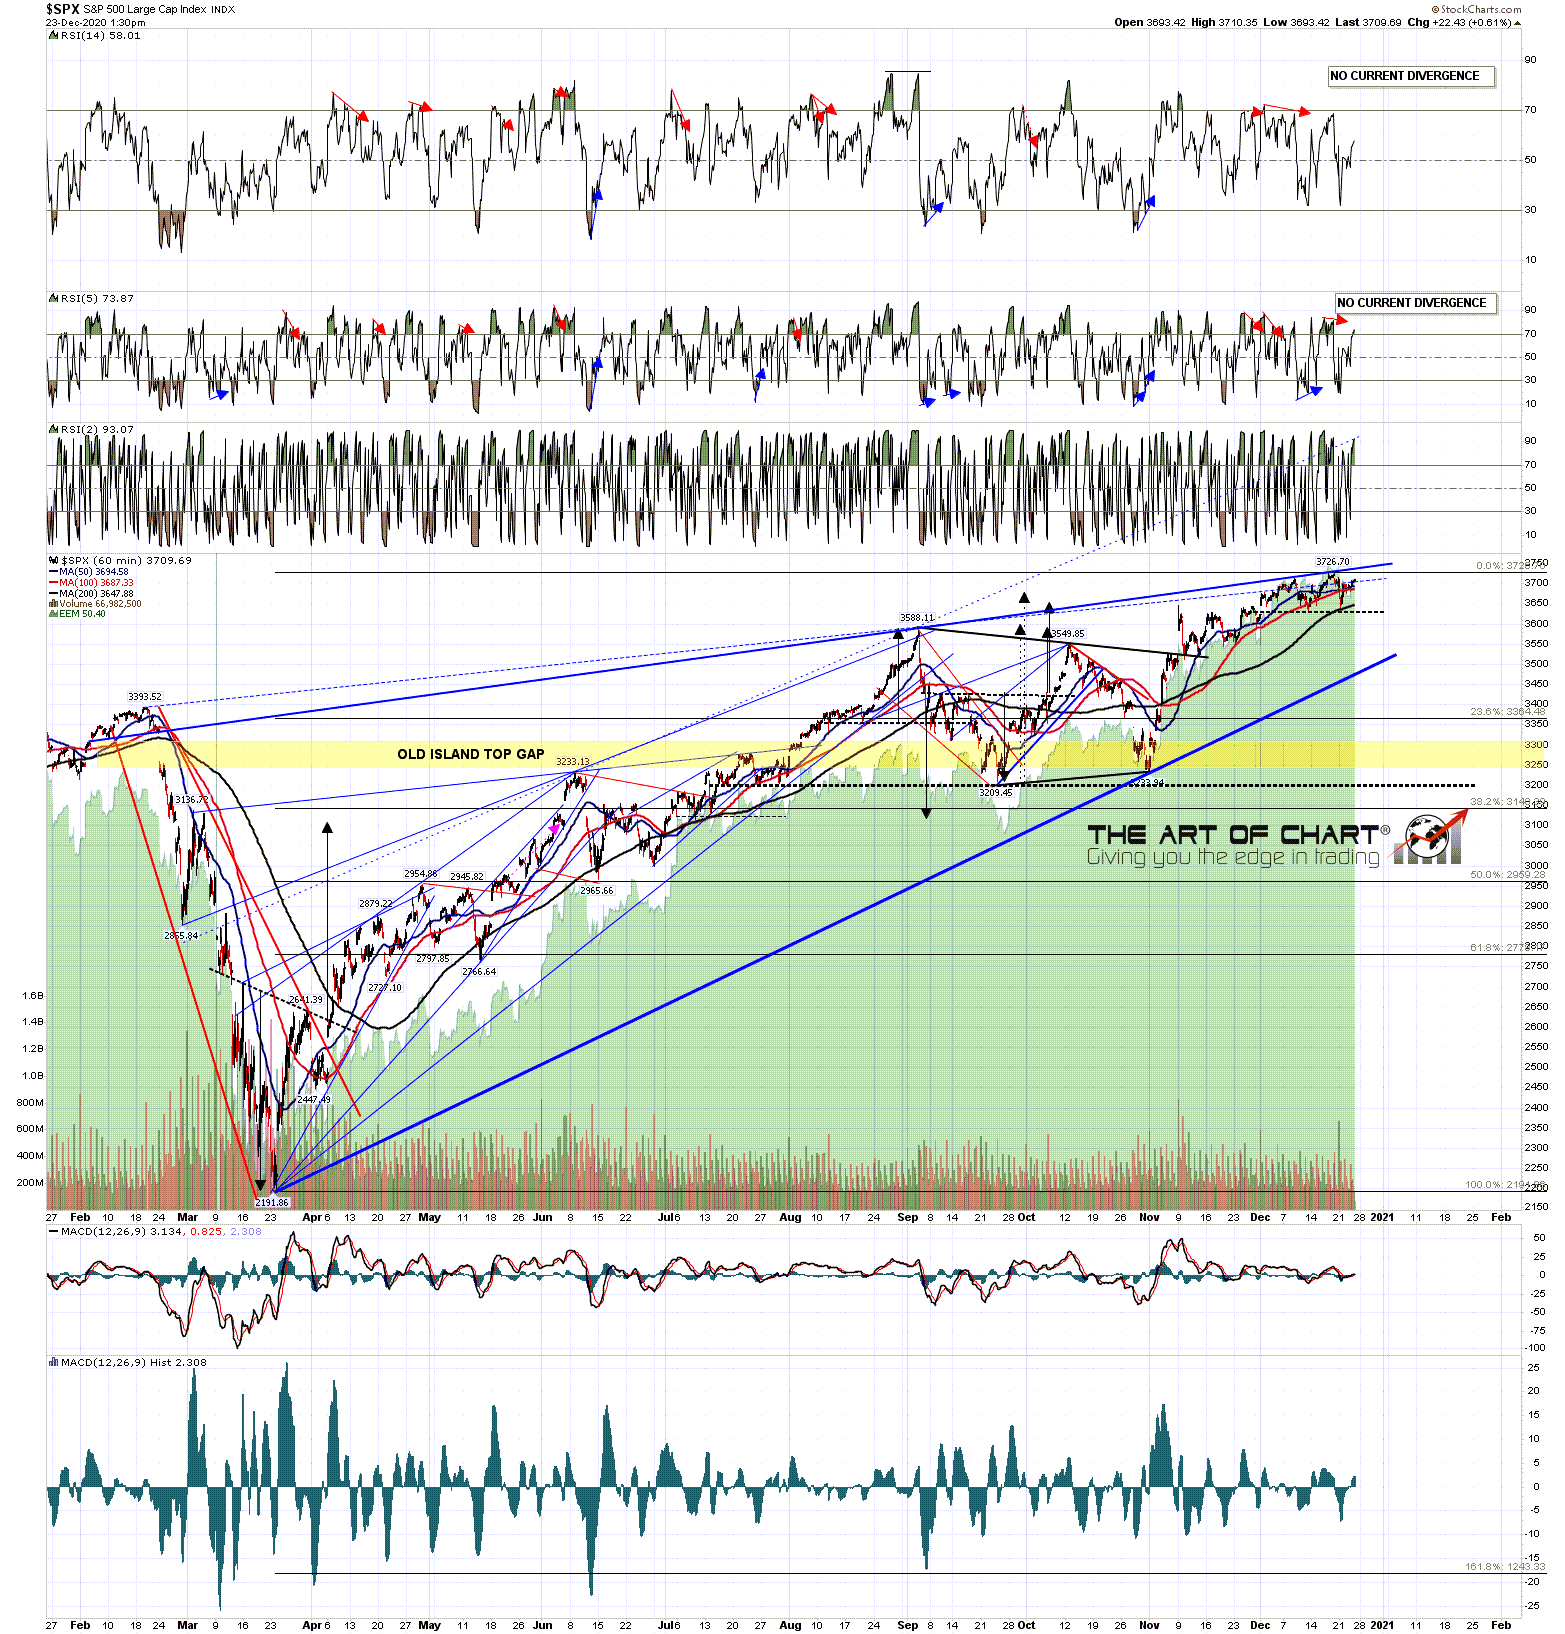
There isn’t much negative divergence on the daily charts here what what I would note is the repeated tests of the daily middle bands on SPX and most other indices notably excepting the Russell 2000. The daily middle band on SPX is now in the 3677 area, and a break and conversion of that level to resistance should signal that the retracement has begun.
SPX daily chart: 
The Dow has also been repeatedly testing the daily middle band as well. No daily closes below that so far, but it is easy to see where current support is, and I’m expecting to see that close below within days.
INDU daily chart:
NDX hasn’t been testing the daily middle band as aggressively as SPX and INDU, but there are still two clear and precise tests in recent days, so that support is very clear there as well. When that support breaks we should see that decent retracement.
NDX daily chart: 
I’ll be working most of next week, as I don’t really like taking many days off work, and Stan and I have two big public webinars planned for the end of the year, looking at the prospects in 2021 for the many instruments we watch across the board, and with a particular focus on commodities, which we are expecting to be the big winners next year. The two webinars we are running are firstly at 5PM EDT on Wednesday 30th January looking at equity indices, FAANG stocks and key sector ETFs and if you’d like to attend you can register for that here. The second webinar is at 5PM EDT on Thursday 31st January looking at commodities including metals, energies, softs, meat and grains and if you’d like to attend you can register for that here. As always all webinars are linked from our monthly free webinars page at our blog, currently December.
We are running our next Trader Boot Camp starting 18th January and this is extremely competitively priced and covers a lot of territory. If you’re interested you can read more about that here.
Lastly we are running our December sale for memberships at theartofchart.net until the end of the year, and that offers annual memberships with four free months rather than the usual two. We won’t be running another of these sales until at least July, so if you are interested you should get this done before the end of December. You can find the page for that here.
I’ll be back at work on Monday and am planning a couple more posts before the end of the year. Everyone have a great holiday weekend. I know I will. 🙂
 23rd Dec 2020
Thanks for sweet charts showing great buy points until converted. Hope to see your pancakes video. Diets take a holiday too during Christmas weekend. Enjoy mate.