Obviously SPX broke up at the last inflection point and may well be on the way to the resistance trendline I mentioned in my last post, currently in the 4400 area.
I’m still leaning towards seeing a decent backtest of the 4000 area over the summer sometime and ideally that backtest would reach the 3800 area. I’ll explain why that is in another post over the holiday weekend and if we were to see that retracement, and then found decent support there, it would set up a potentially very bullish scenario for another leg up.
In the shorter term, the rising wedge from March 2020 broke down on the last retracement and if that break was just an expansion of the wedge, then we should see that test of wedge resistance in the 4400 area next. If seen I will then redraw the wedge support as unbroken.
SPX daily chart:

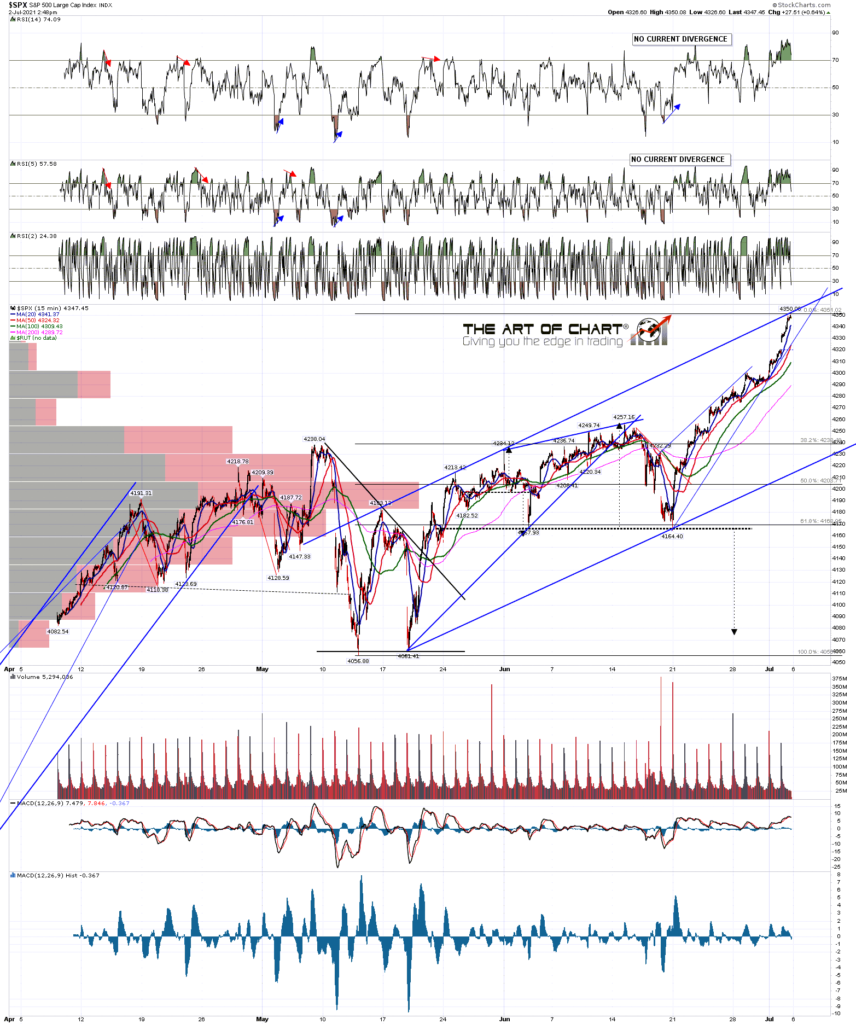
On the shorter term SPX there is a possible resistance trendline at today’s highs so, if that is going to be respected, SPX may need a pullback early next week before going higher.
SPX 15min chart:
On NDX I was showing the chart below early this week in a premarket video showing a double trendline resistance target above. NDX has been lagging this week so that has not been reached yet.
NDX 15min chart:
IWM has been consolidating in a possible triangle. As and when that finishes I have an upside target at the March high at 233.74.
IWM 15min chart:

On Dow a bull flag has broken up with a target at a retest of the June high at 35.1K.
INDU 60min chart:
There is some resistance on SPX in the 4350 area, but looking over the other indices I’m favoring a move to the trendline resistance now in the 4400 area, likely next week as it is a holiday week and the historical stats lean bullish. If that trendline is reached the next decent inflection point will be there.
As I mentioned, I’m planning a post over the holiday weekend to look at the possible backtest of the 3800 on SPX that I think we may see soon, and the pattern implications if SPX was to deliver that backtest and hold that area as support.
We run an annual July 4th sale at theartofchart.net with an additional 20% off the already discounted price for annual memberships, giving effectively four free months on an annual membership until the sale ends. If you’re interested the sale page is here, and remember you need to enter the sale code JULY4SALE in the checkout process.
Everyone have a great weekend.
 02nd Jul 2021