SPX and NDX held the strong resistance they were testing a week ago, retraced a bit, and are now close to testing them again. I have been expecting new all time highs on both, and NDX has made a new all time high today, but SPX is still a bit short and likely needs to make a new one too.
Both RSI 14 and RSI 5 daily sell signals are now fixed on SPX, and if resistance holds again, then next short term high at least is close.
SPX daily chart:
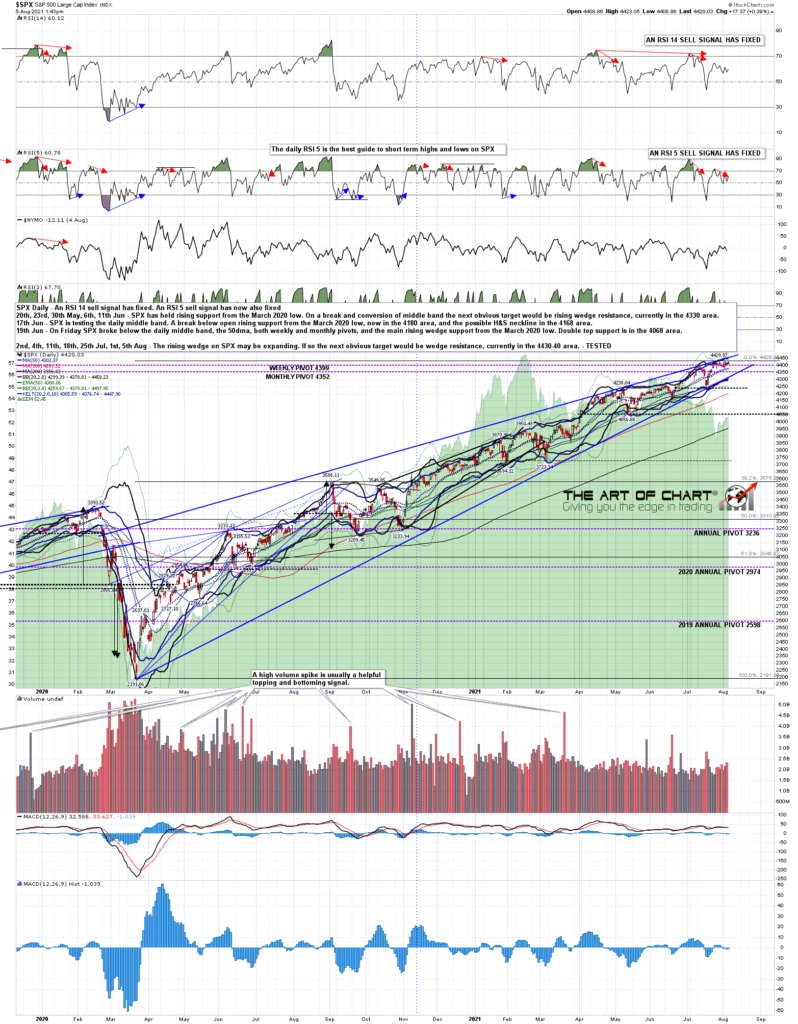
The wedge resistance trendline on SPX is currently in the 4445 – 50 area, so that is approximately in the 4435 – 40 area on ES. That doesn’t need to be hit that we should at least see that new all time high before a turn.
SPX 60min chart:
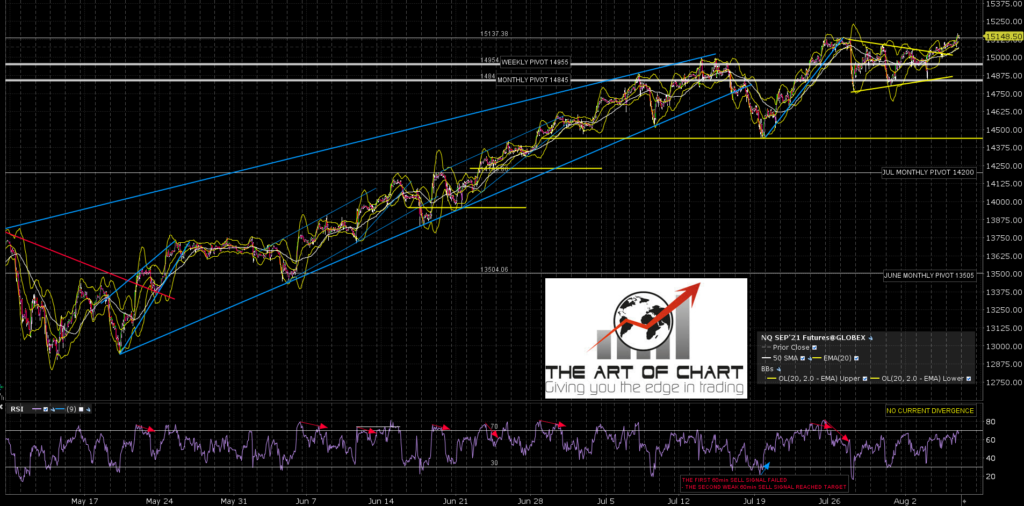
NQ formed a really nice little bullish triangle from the last all time high and that delivered a textbook break up, backtest into the triangle, and move to the (minimum) target at a retest of the all time high. That is a minimum target and NQ/NDX could go a bit higher still.
NQ Sep 60min chart:
On the NDX daily chart the new all time high has set an RSI 5 sell signal brewing, in addition to the daily RSI 14 sell signal already fixed there.
NDX daily chart:
NDX also has a strong resistance trendline, albeit a shorter term one. I’m not expecting a break above that on this move, and that is currently in the 15250 area.
NDX 60min chart:
Where might this short term high take us? Well Every high this year so far has delivered only a modest retracement, but there is still a case for a backtest of the 3800 – 4000 area and not a bad setup here to deliver a backtest of 4000. I’m still thinking we might see a backtest of the 3800 area, if only because the best bullish setup over the next year of so would be confirmed with that backtest. I’m going to find some time to lay out that scenario in a post tomorrow, and it would be a really nice setup if we do see that backtest.
I’ll also be looking at that in our monthly free Chart Chat at theartofchart.net which we are holding on Sunday. If you’d like to attend you can register for that here, or on our August Free Webinars page.
 05th Aug 2021