SPX went to the resistance trendline that I was looking at in my last post and we have seen a 2%+ retracement from there so far.
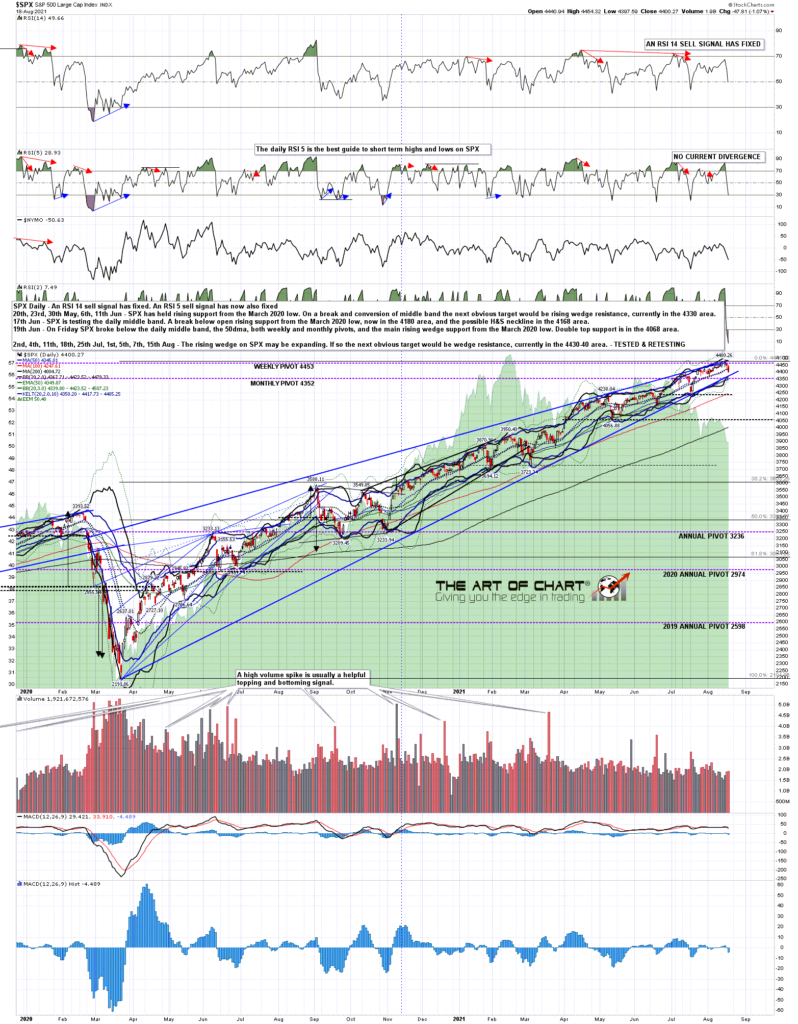
On the daily chart the RSI 5 has reached the 30 level and the close yesterday delivered a clear break below the first big support level at the daily middle band. If that break below the daily middle band is going to confirm today, then SPX needs a close today at or below the SPX daily middle band, currently in the 4325 area.
I was doing an intraday webinar at theartofchart.net on Tuesday after the first leg down on this move and was looking at the obvious rally target at resistance in the 4445 ES area, and on a failure the obvious next target in the 4350 area. With that rally high yesterday at 4449 and the overnight low last night at 4347 I was pretty pleased with that call. If you’d like to see that video it is here.
SPX daily chart:
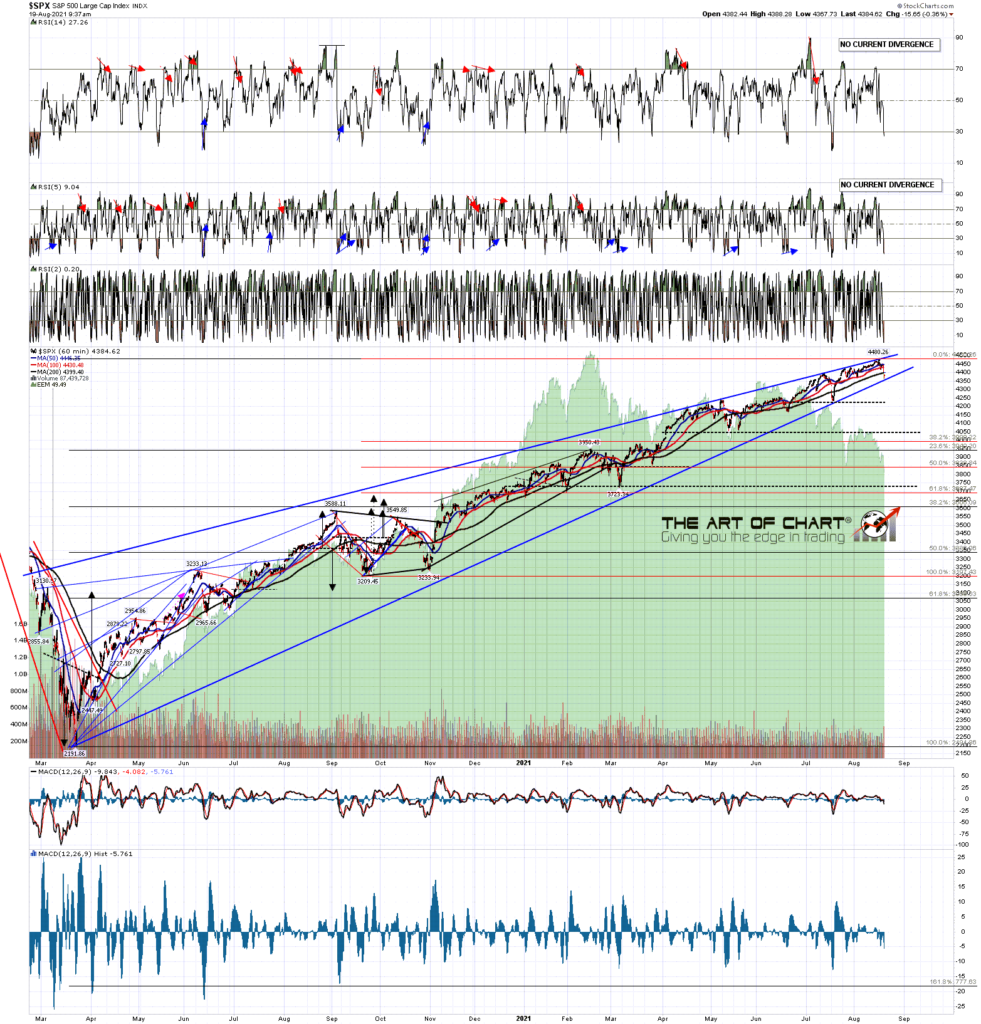
At the open this morning SPX hit a key support level at rising wedge support from the March 2020, and of course this move start with the test of rising wedge resistance from that low. That could be the low for this move of course, and if we do reject back up into the highs the wedge resistance trendline would now be in the 4500 area.
SPX 60min 20Mo chart:
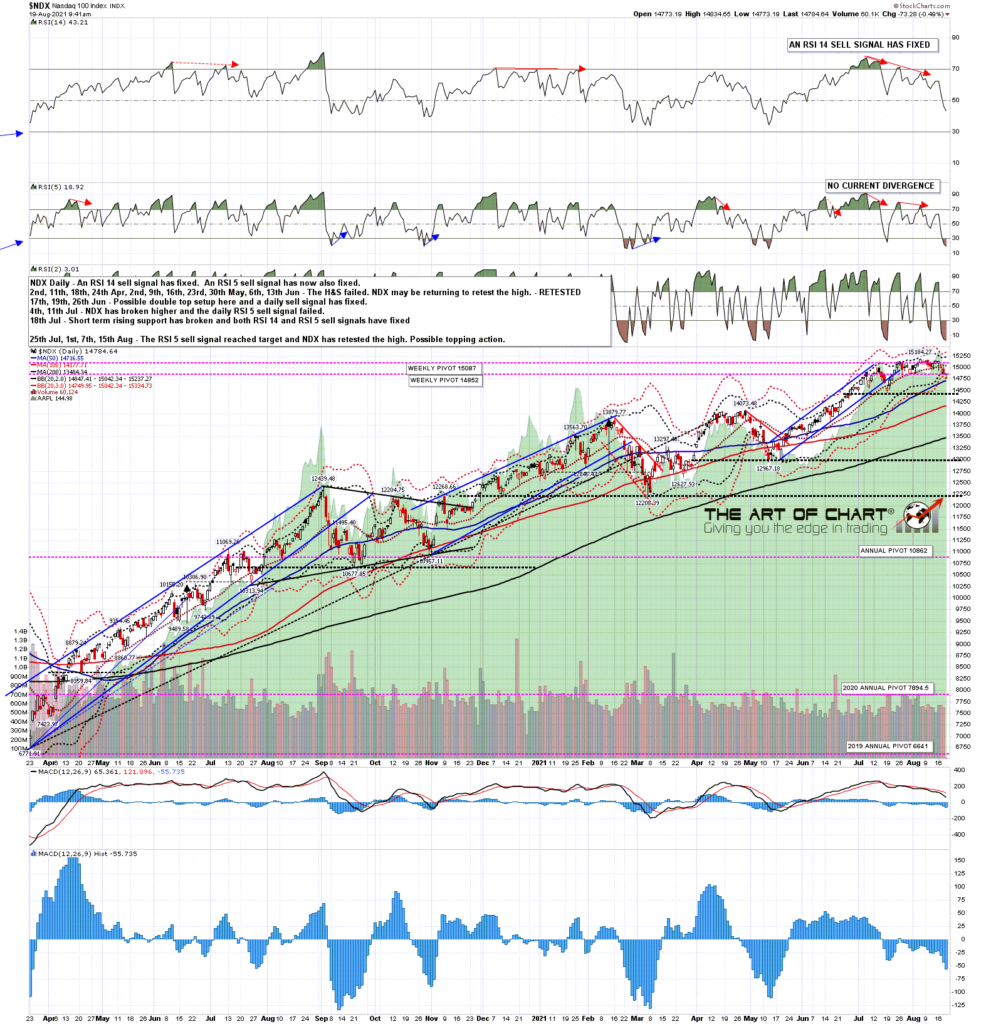
On NDX the daily RSI 5 sell signal has reached target and the first big support level at the daily middle band also broke yesterday. Same comments as SPX above in terms of a rejection candle today and the NDX daily middle band is currently in the 15045 area.
NDX daily chart:

On the NDX hourly chart the nested double top setup is starting to try to play out, with the break below the smaller double top support at the open this morning. If we see further support breaks on the indices, particularly a break and conversion of the monthly pivot at 4345 on ES, then that first double top target is in the big support area at 14430. The alternative is that it rejects back up here into another all time high retest, and we should see one or the other play out.
NDX 60min chart:
We may be seeing the start of a retracement here that would deliver the 3800 area retest scenario that I was looking at in my post on Friday 6th August. There might be a further high retest before that main move starts though.
In the short term the key resistance levels today are the daily middle bands on SPX and NDX in the 4425 and 15045 areas respectively. A close below them today sets up a retest of today’s low and a possible break lower. Rejection candles closing above them today sets up likely retests of the all time highs on both.
An hour after the close today we are holding a free public webinar on trading commodities at theartofchart.net and will be outlining the usual three possible option trades on interesting looking commodities there. If you’d like to attend you can register for that here, or on our August Free Webinars page.


 19th Aug 2021
Pingback: Testing SPX Rising Wedge Resistance Again – The Art Of Chart