In my last post I was looking for a retracement and looking at targets below for the likely backtest that was coming, and those initial targets have been hit, more or less. The main target was the mean reversion target at the 45dma, now at 4417, and the current low this week at 4450 isn’t quite a hit, but came close.
SPX daily vs 45dma chart:

Another target was the backtest of the daily middle band, now at 4467, and that was tested Wednesday and yesterday, and is holding so far.
SPX daily BBs chart:

SPX is rallying from the daily middle band, and broken support on the way down is now resistance. The most important such resistance is at the weekly middle band. That is now at 4518, and a close above it would confirm the weak but definite close above at the end of last week. A close below would be a bearish failure to confirm.
SPX weekly chart:

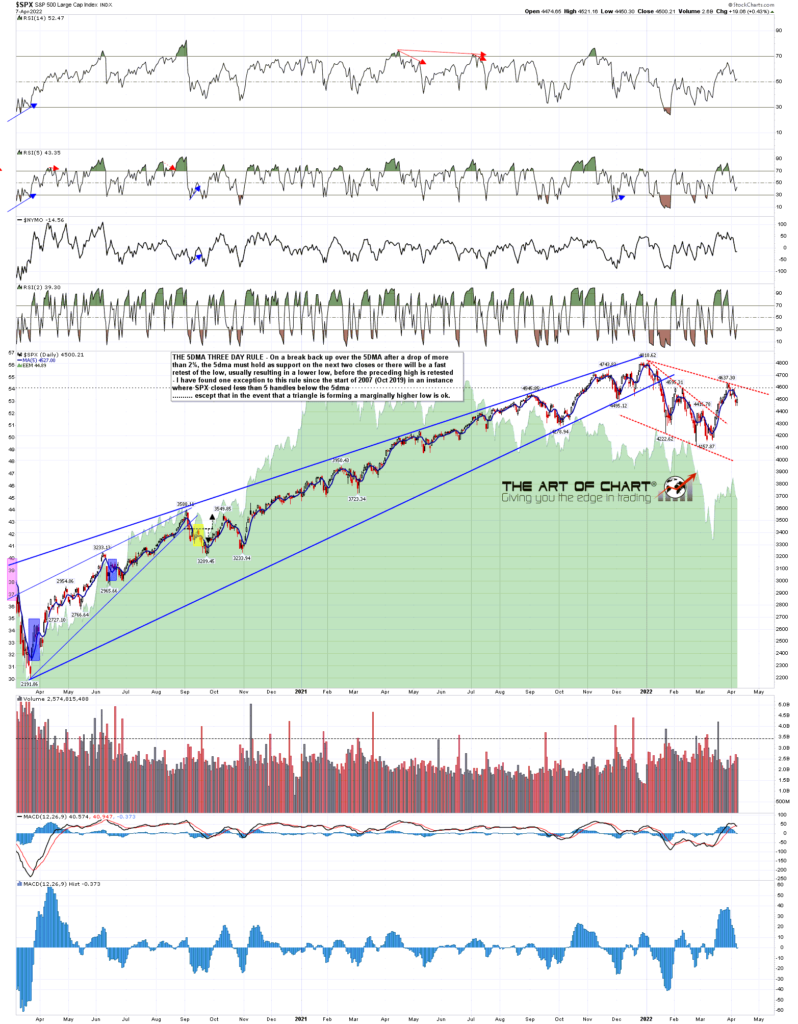
Another important short term level of resistance is the 5dma, now at 4527. That’s not important for a Three Day Rule break, as SPX is still on the Three Day Rule looking for a retest of the 2022 low at 4114.65 before a retest of the all time high at 4818.62, but it is still a significant short term resistance level.
SPX daily vs 5dma chart:
The second important short term resistance level is the 50 hour MA, now at 4546. A break and conversion to support of the 50 hour MA would be a significant short term bullish break, and might well signal that this short term retracement is over.
SPX 60min chart:
So what are the obvious options from here?
On the bear side the war in Ukraine is showing no signs of either ending soon or of becoming less brutal to civilians there. There is also a Three Day Rule target at a retest of the 2022 low.
On the bull side there is also a failed IHS looking for a retest of the all time high, though in the context of an overall bull flag forming from the all time high a lower low for 2022 would be perfectly acceptable before that retest of the all time high.
Overall I’m leaning towards a break down here but it may as always go the other way. We should have a clearer view by the close on Monday.
In the short term the failure to quite make a lower low on SPX yesterday means that there is no hourly buy signal on SPX here, and possible H&S patterns are forming on all of SPX, NDX and INDU. In the absence of a definite break up in the next couple of days, these are setting the scene for a possible hard break down instead next week.
We are doing our monthly free public Chart Chat on Sunday at 4pm EST and we will be looking at this further then as well as the usual wide range of other instruments and markets. If you’d like to attend you can register for that here. As always you can alternatively register for those on our monthly free webinars page.
 08th Apr 2022