SPX broke down and has retested the retracement low, as have NDX and Dow as well, but not yet IWM. This brings SPX and the other US indices to the key inflection point this year, where we see whether the move so far this year has been the formation of large bull flags setting up retests of the all time highs, or whether US indices are going to break down further directly.
What we have on the bull side here are possible buy signals now brewing on the weekly chart and clear high quality bull flags formed on SPX and Dow particularly, as well as on many other individual stocks and ETFs of course. On the bear side we have the worsening economy, rising interest rates and embedded inflation that the Fed are now admitting is not transitory. I would point out though that a retest of the all time highs might well not be a bullish development, as that might make the second highs on double tops large enough to then potentially retrace most or even all of the gains made since the 2020 low.
I’ve been looking for a high volume exhaustion day to the downside, and I was thinking that yesterday might be that day. There was significantly higher volume yesterday, but the SPX volume didn’t reach the 3.5bn line that I generally look for as a clear signal that a strong reversal may be brewing.
SPX daily chart:
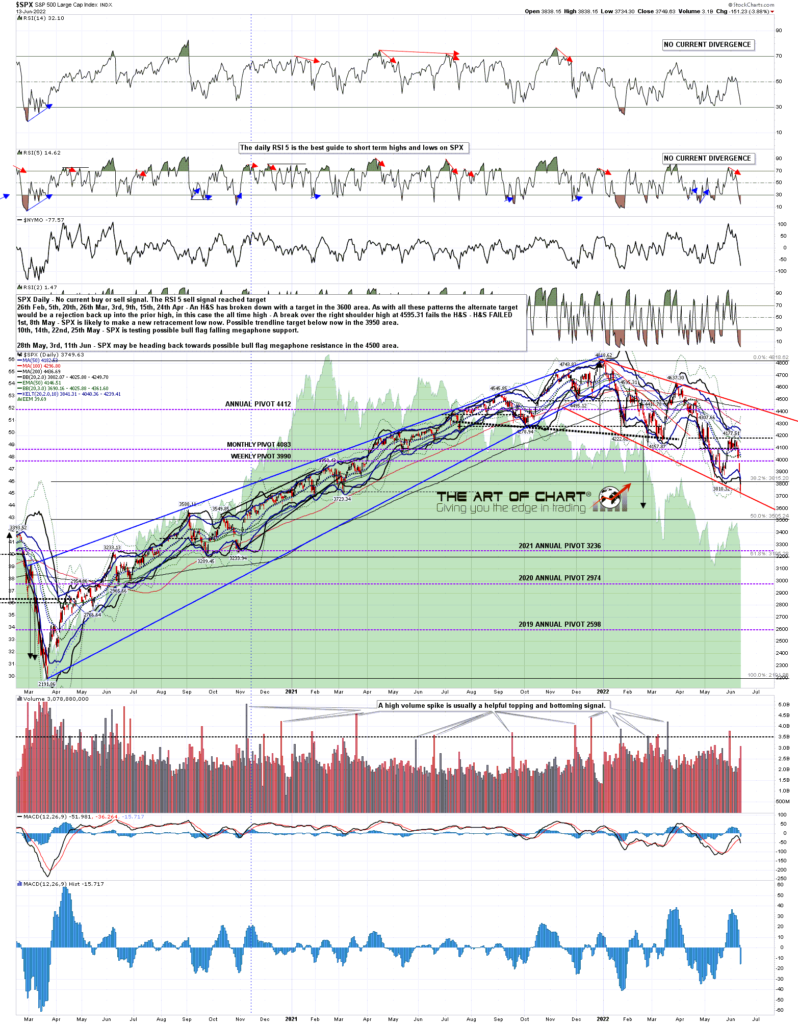
The daily bollinger bands on SPX are turning down again and expanding. SPX broke well below the daily lower band yesterday and is potentially in range of the 3sd lower band, which closed yesterday at 3690. If we were to see that hit in the next day or two that would be an excellent area to see a strong bounce.
SPX daily BBs chart:

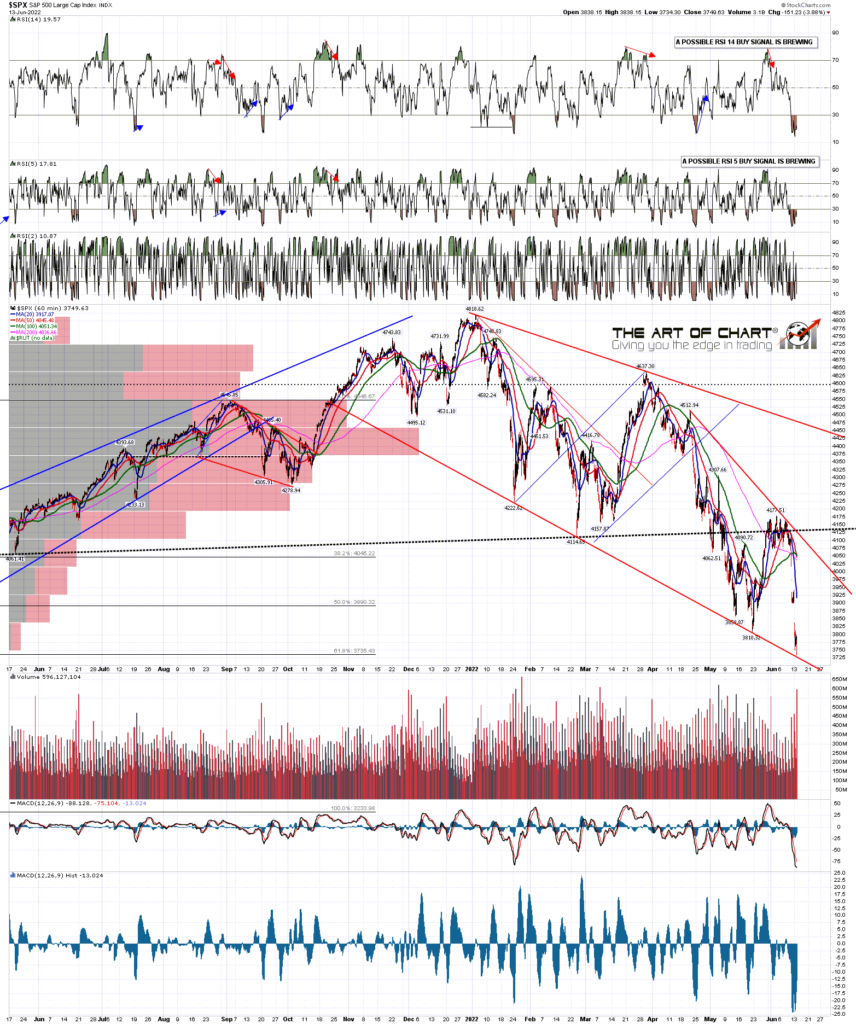
I show the bull flag on SPX on the hourly chart below. The support trendline is very nice and the low yesterday was close to it so that may well hold as support short term. On either scenario it seems likely that we will see a rally start today or tomorrow and then see another retest of the low before a decent rally, probable on the bear scenario, or a reversal back up to retest the all time high on the bull scenario.
SPX 60min chart:
I’m showing the Dow Industrials daily chart below to show the very nice looking bear flag that has formed there.
I sometimes get the question as to whether bull flags ever break down and the answer is obviously yes. In fact on small timeframes and other instruments I have seen clear examples break down at least twice in the last month. Any pattern can always break in an unexpected direction or just evolve into something else. Technical Analysis can give you a high quality educated guess as to what comes next, but nothing is ever certain in the markets.
INDU daily chart:

That brings me to my last chart, which is the TNX (10 year treasury yield) chart. This has been an important chart to watch this year and, back in early February, on a break up from an IHS that had formed over the previous two years, I called a target at 32, at almost double the level at the time.
We could also see a strong reversal back down on TNX here, as I mentioned back in February that there is a possible IHS neckline in the 32.5 area, broken slightly yesterday, with a decent alternative in the 40 area if it goes higher. If we were to see the higher alternate then an IHS might form that could take TNX to 75 in a year or two. I think seeing interest rates back at that level is likely just a matter of time, so I’m watching this with great interest.
TNX monthly chart:

The historical stats for this week lean modestly bullish, and I’m looking for a short term low on SPX in the next day or two.
Stan and I have always been bad at boasting about past calls, or marketing as that is often called nowadays, but I’m going to be hooking out three really nice calls that I have made in the last year or two. The one I like best was on Natural Gas in early 2020, when NG was in the 2.0 area, and I called for a retest of the low at 1.61 to finish a bullish setup to take NG up to the 8.1 level that was reached a few weeks ago. In Technical Analysis we can only ever see through a glass darkly into the future, but we do sometimes nonetheless see some amazing things. I’ll be digging out the video from the time to post that.
I’m planning another morning post on Thursday or Friday, subject to what happens in the meantime. Everyone trade safe. 🙂
 14th Jun 2022
Pingback: Grey Swans – The Art Of Chart