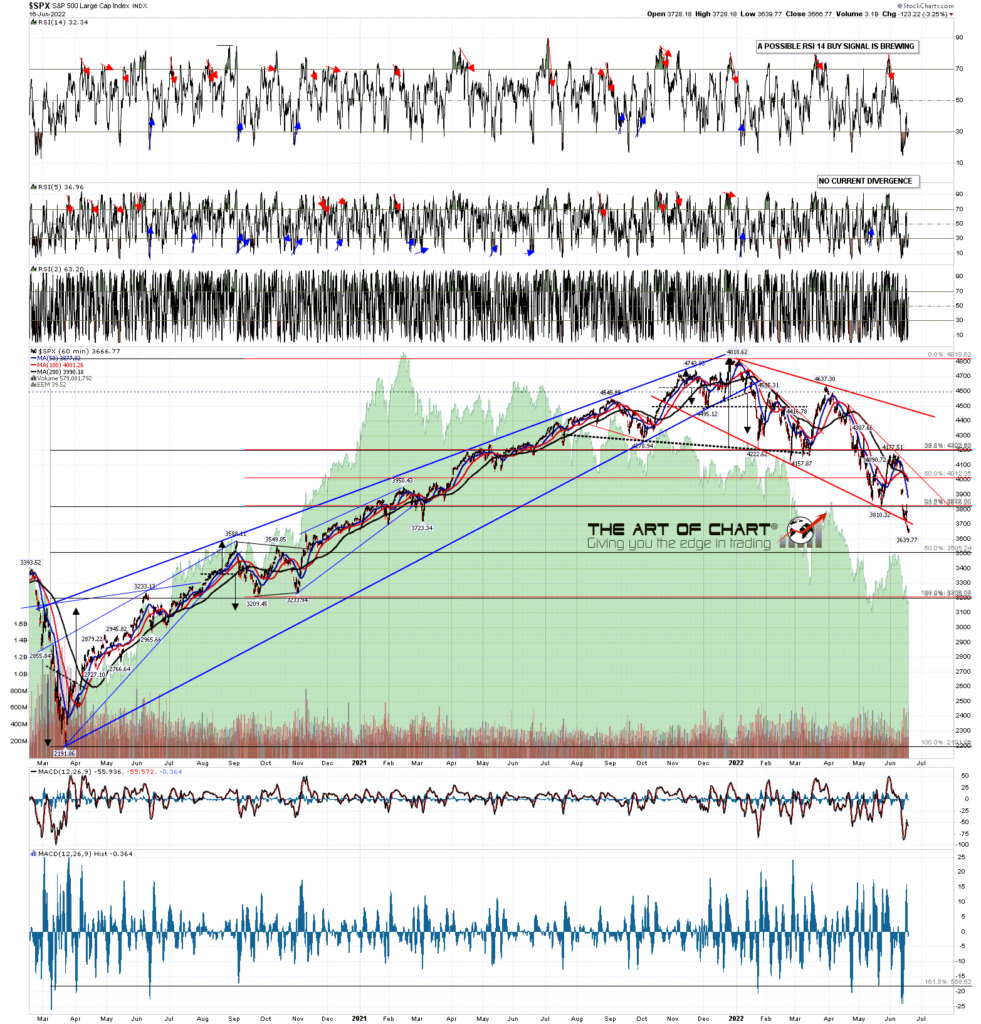
I wanted to talk a bit this morning about big highs and lows on SPX. Obviously the economy may well be going into recession, interest rates will likely rise a lot further over coming years, and that has to happen really because examples in history where inflation has been brought under control without interest rates higher than that inflation are rare. The world is also particularly vulnerable to high interest rates because after so many years of very low interest rates, levels of both public and private debt are extremely high, and rising interest rates over time will likely force many people, companies and governments into defaulting on their debt. It is going to be rough.
The Fed has underpinned both the economy and asset markets for many years with low interest rates and easy money, but it’s hard to see how that can be of much use here. I’ve heard it said that chocolate is the cure for all the ills of the world except stomach ache, and the Fed’s usual responses here would seem likely to turn a crisis into a disaster. The Fed’s options here in terms of the economy therefore look minimal and any market relief they can provide is likely to be transitory.
All that said we have good quality bull flags formed here from the highs on many indices, ETFs and stocks, and SPX has a VERY strong history of retesting highs and lows at important tops and bottoms. Even if SPX is going lower afterwards, the all time high may get a retest first and, if seen, that would of course set up a possible double top to take SPX lower. The outlook looks grim, but the old Buffett maxim is to buy when there is blood in the streets, and there is certainly a lot of that here. We are likely to see a very decent rally soon, and if SPX can break back over the weekly middle band, currently at 4245, and convert that back to support, then a retest of the all time highs is still possible.
On the weekly chart there is now a possible RSI 5 buy signal brewing, and SPX has punched well below the lower band, so there is a decent setup for a rally here.
SPX weekly chart:
The historical stats for the rest of June are neutral, except for Friday 24th, which leans 71.4% bearish.
In the short term there is a lot of positive divergence here and I’m leaning towards at least a modest rally today and Monday. After that there is likely at least one more low retest coming, ideally on high volume to give a decent low signal. On the historical stats the back end of next week would be a good time to see that.
We hold a couple of sales on annual memberships every year at theartofchart.net, and the summer sale starts today, with an extra 20% off annual memberships, so eight months for the price of twelve. If you’re interested the subscriptions page is here, and the sale code is july4sale.
I should mention again that our Follow The Leader service at theartofchart.net is up 100% so far this year. The technology to support this service is provided by our partner, GFF Brokers. GFF Brokers is an authorized broker for the World Cup Trading Championships Advisor programs. The profits on that so far this year on the nominal account of size at $25k would be enough to pay the Triple Play subscription at the standard monthly price for ten years. Follow The Leader is included in the Daily Video Service and the Triple Play Service, which includes the Daily Video Service. If you’d like to try a free trial of the Triple Play service you can find that here.


 17th Jun 2022
Pingback: Testing Main Resistance – The Art Of Chart
Pingback: Grey Swans – The Art Of Chart