Daily RSI 5 buy signals have fixed across the board on SPX (weak), NDX (full), IWM (full) and Dow (weak), so it is possible that the rally may extend significantly further without a low retest. There are also fixed hourly RSI 14 buy signals fixed on all four and none of those have yet made target, though a couple of those may make the possible near miss target on the gap up this morning.
SPX daily chart:
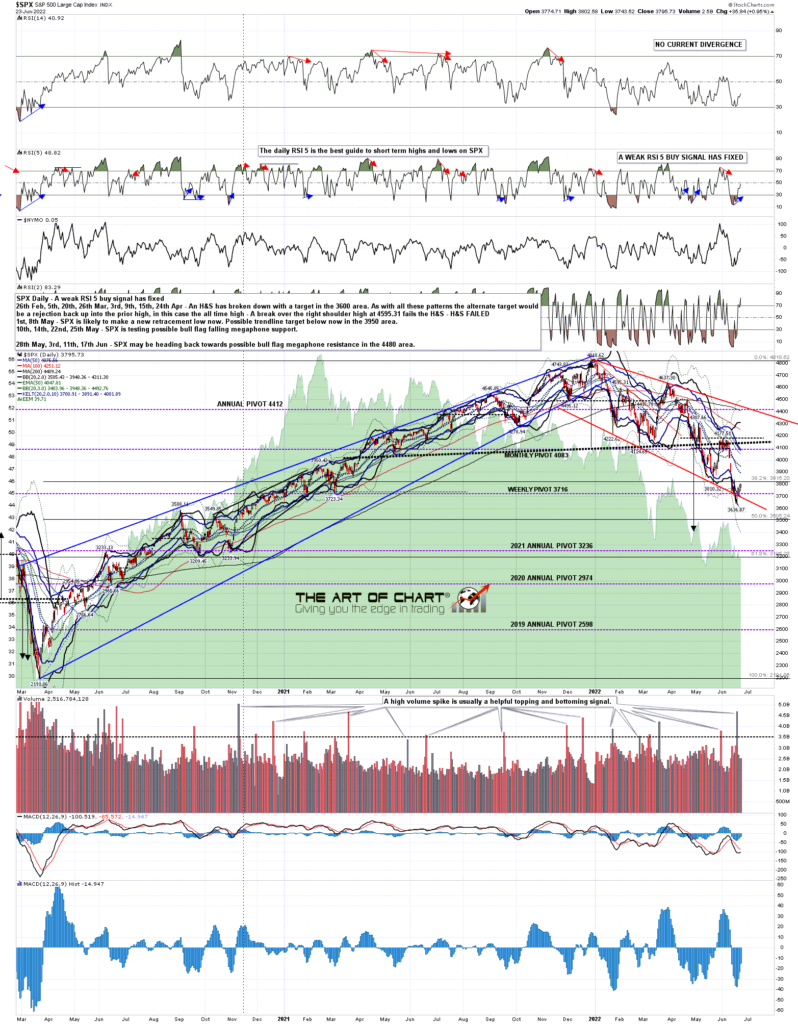
The first resistance for this rally was in the 3785-3800 area, with the SPX double bottom target at 3785 and a really nice topping setup that formed there which is worth a look as it is a very nice example of a strong topping setup that I was following on SPX until it failed yesterday afternoon.
Obviously yesterday was the third day on the Three Day Rule, so bears needed to deliver a daily close below the 5dma in the 3725 area to trigger the Three Day Rule setting up the retracement low retest. A very nice looking topping setup formed on Wednesday afternoon and much of Thursday with an initial H&S marked in red that broke down on Wednesday afternoon to complete the head on the second pattern, in purple.
On Thursday morning there was a gap up into a near perfect H&S right shoulder and that broke down yesterday with a target in the 3710 area, and had that delivered into the close then SPX might have triggered the Three Day Rule retest into the today’s bearish historical stats of 71.4% red closes. That would also have set up the third possible asymmetric double top or H&S, marked in black, to deliver the move back to the retracement low.
However SPX instead delivered a classic rejection back into a retest of the rally high. So where does that leave us this morning?
SPX 1min chart:

Well obviously the retest of the rally high yesterday afternoon set up a possible double top setup, but that has been considerably weakened by the overnight gap up that looks likely to fix at the open.
The other main option is that the initial rising wedge from the retracement low is expanding, with a new rising support trendline established at yesterday’s intraday low. If so the obvious next target within the wedge would be wedge resistance, which closed yesterday in the 3827 area, and isn’t far below the 15th June high at 3837.56, which is of course a possible IHS neckline. That test looks likely today and we’ll see how that goes.
SPX 5min chart:

The resistance trendline on the SPX wedge isn’t great quality though, and there is a better example on Dow which looks similar, but has a very nice three touch resistance trendline. That trendline is now in the 30,970 area, just below the 15th June high and possible IHS neckline in the 31,000 area.
INDU 5min chart:
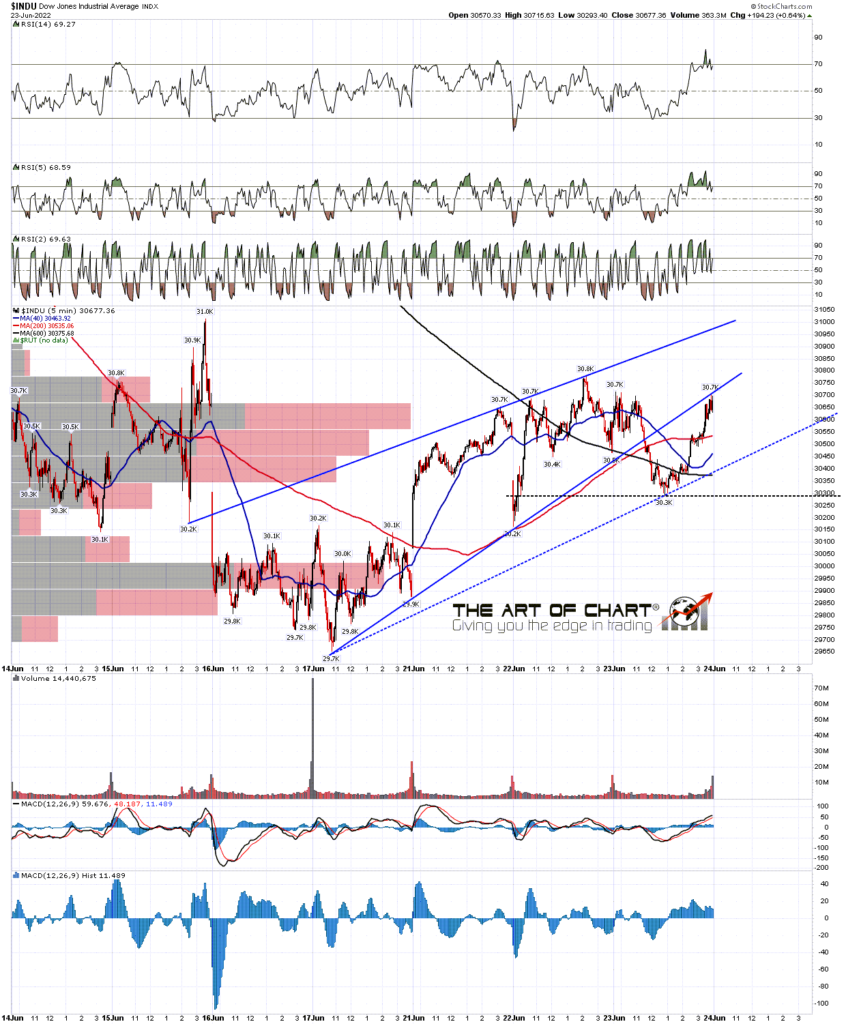
The historical stats for today lean 71.4% bearish, and would have been ideal for a retest of the retracement low, but the setup to get there fell apart from yesterday afternoon and I’m very doubtful about seeing that today. I like resistance in the 3840 SPX area today and I like the chances of that holding. If so we could see an IHS right shoulder form that would have an ideal right shoulder low in the 3705 area. If that IHS forms and breaks up that would have a target in the 4037 area, well above the next big resistance area which is the daily middle band now in the 3948 area.
We hold a couple of sales on annual memberships every year at theartofchart.net, and the summer sale is now on, with an extra 20% off annual memberships, so eight months for the price of twelve. If you’re interested the subscriptions page is here, and the sale code is july4sale.
I should mention again that our Follow The Leader service at theartofchart.net is up 100% so far this year. The technology to support this service is provided by our partner, GFF Brokers. GFF Brokers is an authorized broker for the World Cup Trading Championships Advisor programs. The profits on that so far this year on the nominal account of size at $25k would be enough to pay the Triple Play subscription at the standard monthly price for ten years. Follow The Leader is included in the Daily Video Service and the Triple Play Service, which includes the Daily Video Service. If you’d like to try a free trial of the Triple Play service you can find that here.
 24th Jun 2022