SPX rallied further on Friday to test the monthly pivot at 4078, and has been trading above it overnight. A string of decent quality double bottoms have broken up on the equity indices and if we are to see further upside then the next big resistance on SPX is at the daily middle band which closed on Friday in the 4108 area. This brings us to a big inflection point that should determine direction for the next few weeks.
On the bear side the daily middle band should hold as resistance. That can either happen with a fail directly at or under the daily middle band, or with a break above it that fails to follow through to convert it back to support. That would normally be delivered with a clear break above it that then rejects back below it the following day.
On the bull side the daily middle band needs to be broken and converted back to support, which would open up a possible move to retest the rally high at 4325.20, and perhaps then higher, as if that retest is reached all of the decent looking bull flag setups from the all time highs would then have broken up, opening up a possible retest of the all time highs on equity indices.
Is that all time high retest possible on equity indices in this economic environment? Well SPX really does like to retest highs and lows, and with inflation and bond yields where they are, effectively leaving bonds at significantly negative real interest rates and extremely unattractive as any kind of hedge against inflation, perhaps that might be enough to deliver a high retest, though, if seen at all, I’d be doubtful about seeing much more than that.
I can say that we have seen some really crazy things happen on the markets over the last thirty years and I don’t think an all time high retest here would be the craziest. We’ll see. As ever I’ll be led by the charts as being an armchair economist has rarely been much use forecasting short or medium term moves on the markets.
SPX daily chart:

On the SPX chart a double bottom has broken up with alternate targets in the 4130 and 4155 areas. A 15min RSI 14 sell signal has fixed though that may or may not deliver some retracement today.
SPX 15min chart:

On the NDX chart a double bottom has broken up with alternate targets in the 12880 and 12970 areas. A 15min RSI 14 sell signal has fixed though that may or may not deliver some retracement today.
NDX 15min chart:
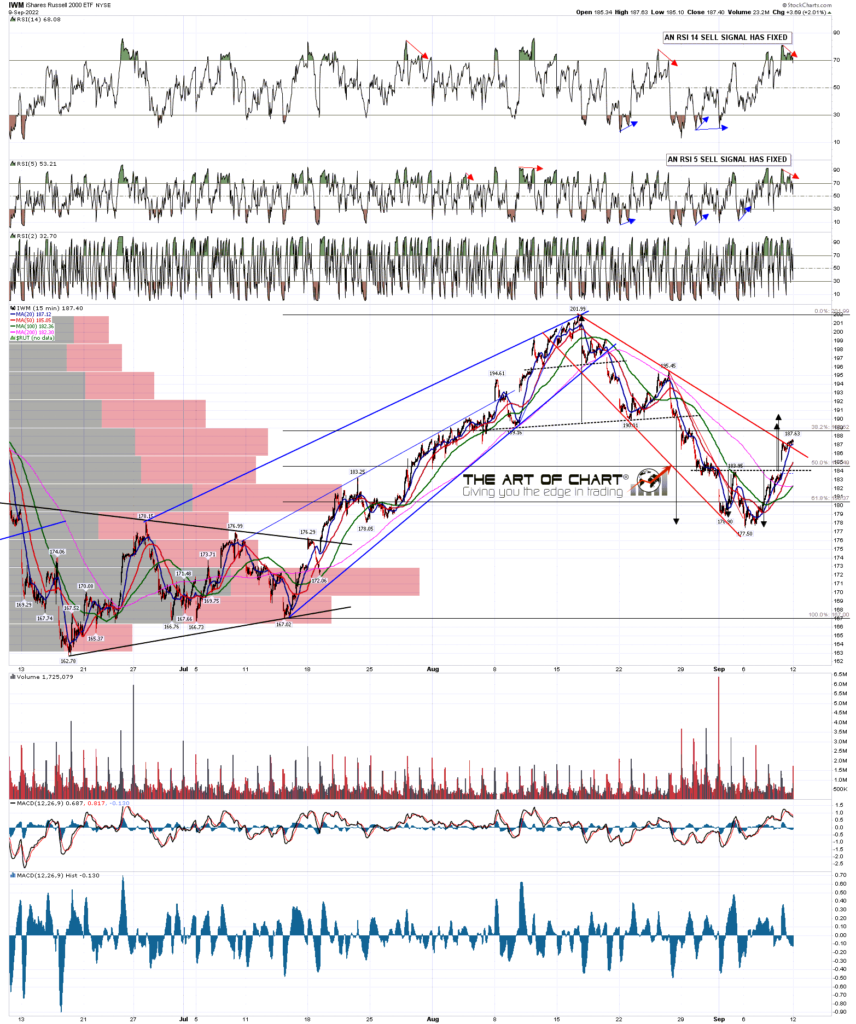
On the IWM chart a double bottom has broken up with alternate targets in the 189.5 and 190.7 areas. A 15min RSI 14 sell signal has fixed though that may or may not deliver some retracement today.
IWM 15min chart:
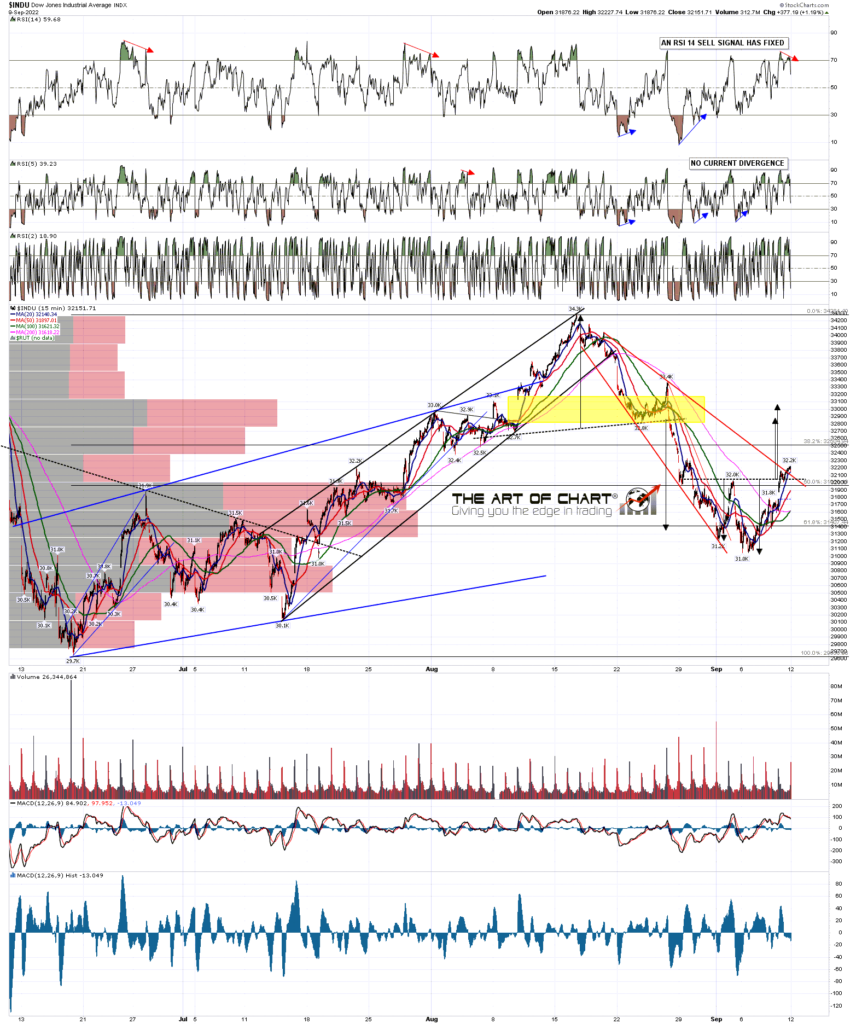
On the Dow chart a double bottom has broken up with alternate targets in the 32890 and 33080 areas. A 15min RSI 14 sell signal has fixed though that may or may not deliver some retracement today.
INDU 15min chart:
Historical stats this week lean 71.4% bullish both today and tomorrow, neutral on Wednesday and Thursday this week and Friday this week also leaning 71.4% bullish into Opex. As a group this is one of the most bullish leaning trading weeks of the year, though not so much on NDX in recent years. In a strong trend down that wouldn’t matter much but in the absence of that we could see a decent move up into the end of next week.
In the short term we have those solid looking double bottom setups breaking up on SPX, NDX, IWM and Dow so we’ll see how those fare today.
We are did our monthly free public Chart Chat at theartofchart.net yesterday and if you missed it you can see that here or on our September Free Webinars page.
My next post should be on Friday before the open.
 12th Sep 2022