I was saying in my post on Monday that a fail at the test of the daily middle band generally happens in one of two ways. The first way is the usual test and fail, and the second is a break above that is rejected the next day. Obviously SPX took the second option and delivered a memorable rejection candle. That was bearish with an obvious minimum target at a retest of the daily lower band, which closed yesterday at 3823. I’m expecting that target to be reached, and likely lower. A retest in the next few weeks of the 2022 low at 3636.87 is now firmly on the table as my primary scenario.
SPX BBs chart:
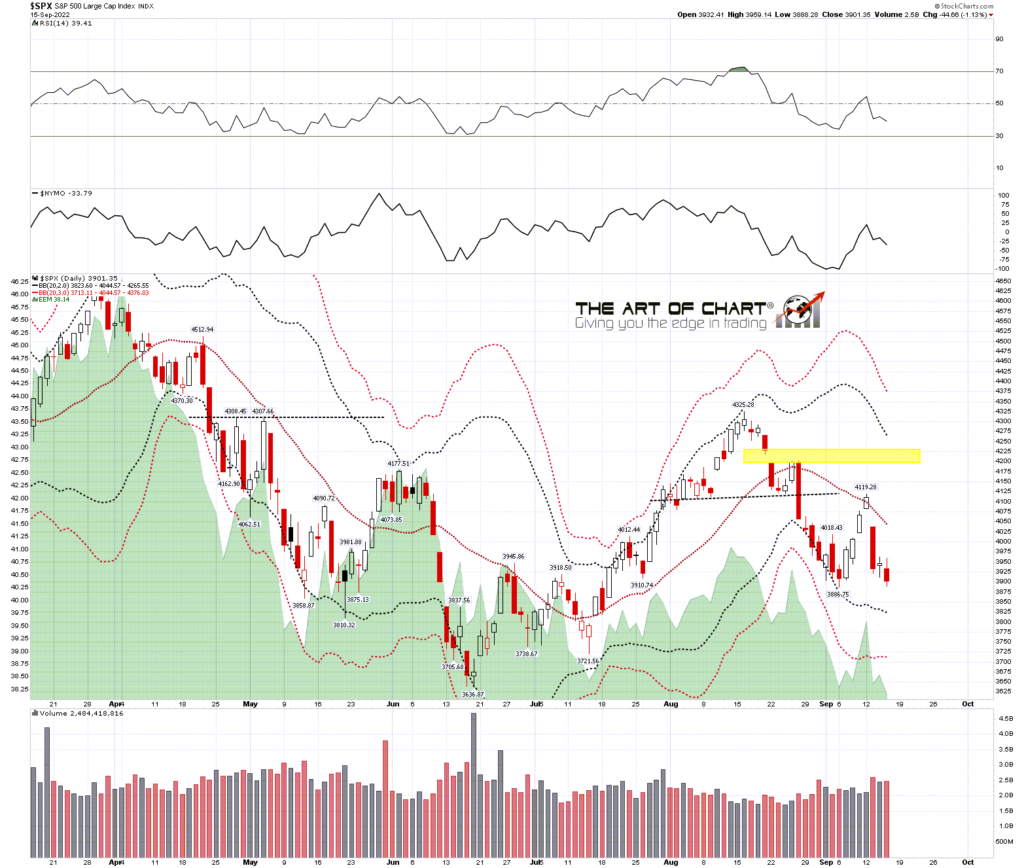
On the SPX chart there was a decent quality double bottom that formed and broke up on Wednesday afternoon, but rejected back into a lower low. On Thursday there was a really nice double bottom option looking for a backtest of the 4000 area, supported by a lot of 15min and hourly buy signals across the US indices and futures. That too broke up and then rejected into back into a lower low. This downside move has shown a lot of strength in those two rejections and I think the next real support is likely to be in the 3800 area.
In the short term SPX in still on a 15min buy signal and the best looking support trendline option is now in the 3790-3800 area.
SPX 15min chart:

On the NDX chart the best looking support trendline option is now in the 11500 area.
NDX 15min chart:
On the IWM chart the best looking support trendline option is now in the 173 area. That may be hard to reach on this move as IWM has held up the best of the US indices so far this week.
IWM 15min chart:

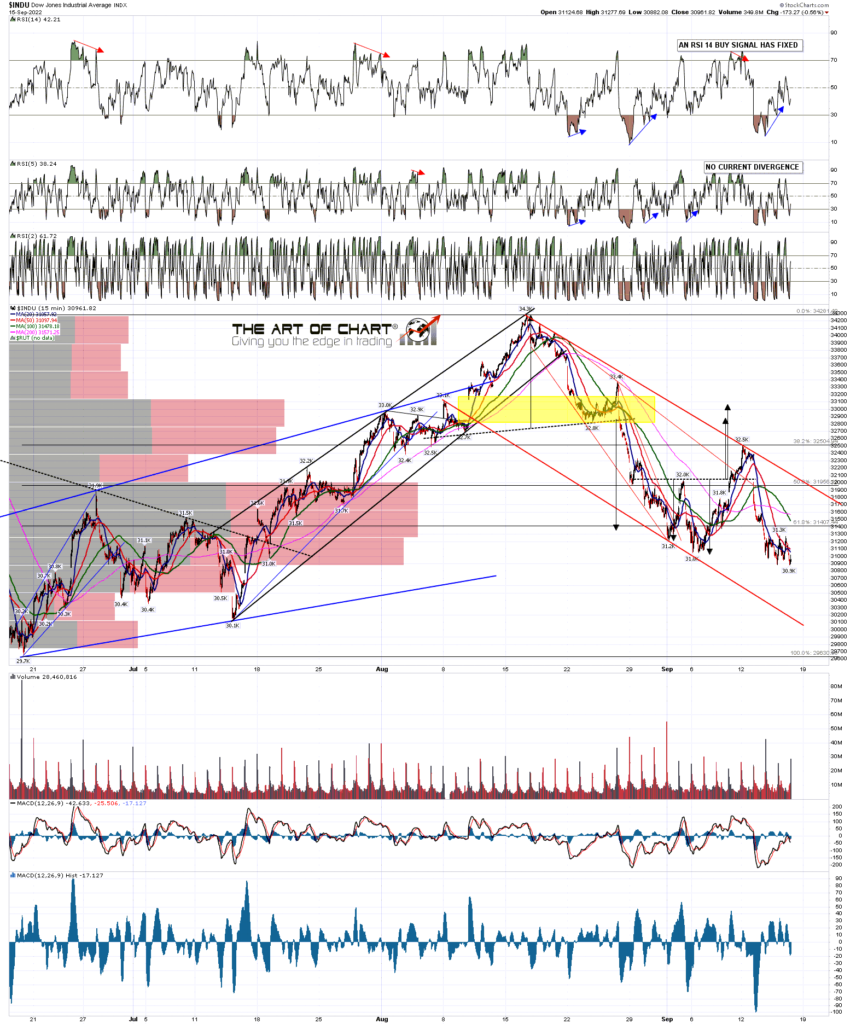
On the Dow chart the best looking support trendline option is now in the 30150 area.
INDU 15min chart:
It is opex Friday today so the market often doesn’t move much after lunch. The positive divergence here is telling us that we could see a rally soon, but the failure to sustain a rally on either Wednesday afternoon and yesterday suggest that SPX will be testing 3800 before there is another serious attempt at a rally.
The historical stats for next week lean neutral on Monday and Tuesday and then there is are four consecutive trading days from Wednesday 21st September through Monday 26th September which all lean significantly bearish. Ideally therefore we would see the next rally Mon/Tues next week and then another leg down after that. I’m expecting to see a retest of the 2022 low at 3636.87 in the next few weeks, and that might well be sooner rather than later.
My next post should be on Monday before the open. Everyone have a great weekend. 🙂
 16th Sep 2022