Last Friday there was a clear break back below the 5dma, and that was a fix under the Three Day Rule. On this rule SPX should retest the last low at 3491.58 before any retest of the prior high at 3806.91. I haven’t counted but there have been nine previous fixes in 2022 and I’d be surprised if this rule hasn’t fixed well over 100 times since the start of 2007 and on the current rules for this, after a small tweak in 2019, there has not yet been a failure, although there have been two marginal higher lows when triangles were forming at the lows.
I have mentioned that there is no such thing as a perfect market stat, and that I would therefore expect to see a fail on this stat at some point, but there’s no particular reason to think that would be here. I have been asked this week what I would expect to see if it does fail here but, as that hasn’t happened before, I have no idea, though it would open the next possible resistance level in the 3900 area.
The chances are that the Three Day Rule will deliver again this time and, if so, upside from here is limited and SPX has likely either turned down already, or is currently topping out for the next move down to retest 3491.58.
SPX daily 5dma chart:

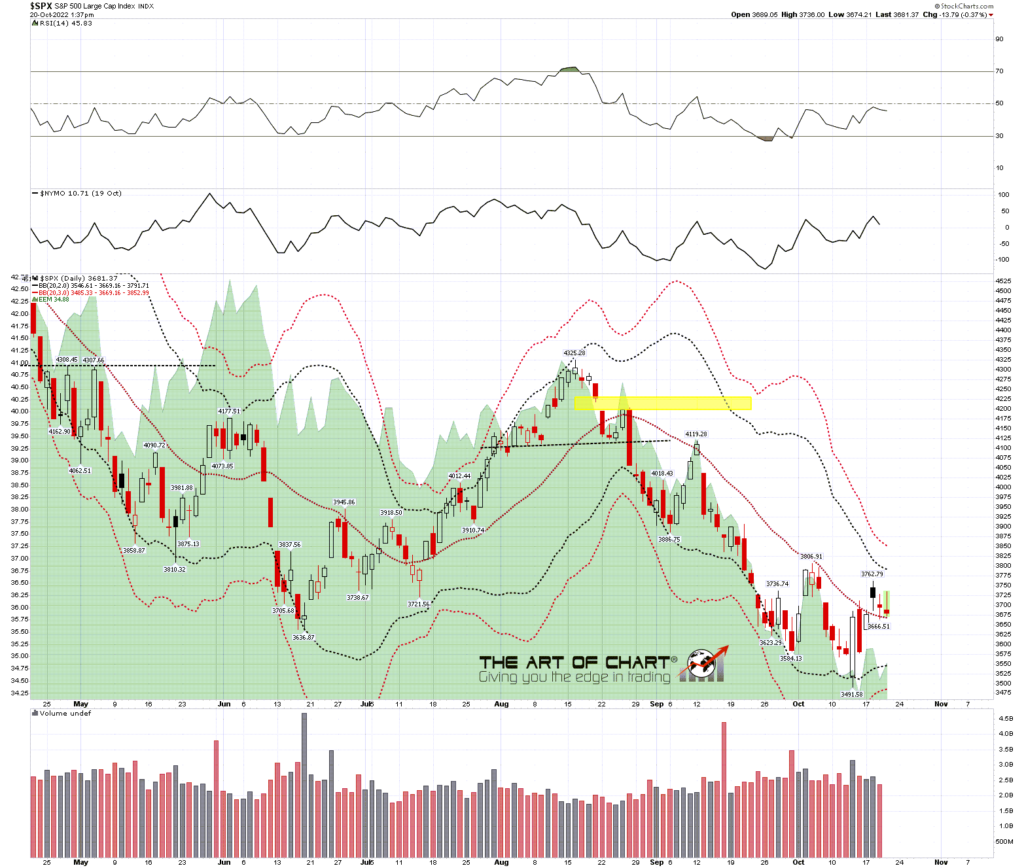
I was thinking that we would likely see SPX fail to convert the middle band to support on this move but SPX gapped back over the daily middle band on Tuesday morning and did the confirming close above it yesterday. Short term support is therefore at the daily middle band, currently at 3666.51. When SPX closes back below it and confirms that close then the next move down should have started.
SPX daily BBs chart:
On the SPX 15min chart a decent quality rising wedge formed from the 2022 low and that broke down yesterday. Now that could be just because SPX is establishing a less steep support trendline but, under the circumstances, I think SPX is topping out and while it may already have topped, there is some reason to think that a retest of the current high at 3762.79 is needed.
SPX 15min chart:

I posted the chart below on my twitter this morning showing a decent looking bull flag wedge that on a break up would look for a retest of 3762.79. That broke up later on this morning though that high has not been retested because (opportune teaching moment) ……..
SPX 5min chart:

……. sometimes the bull flag then evolves into a larger bull flag. This is worth noting as it happens quite a lot. In this instance the initial bull flag wedge has evolved into a larger bull flag channel, marked in the dotted blue lines.
Not all bull flags break up of course, and this one hasn’t broken up yet, but if it breaks up and retests the high at 3762.79 that would set up a high quality double top that could deliver most of the move back down to 3491.58.
SPX 5min chart:
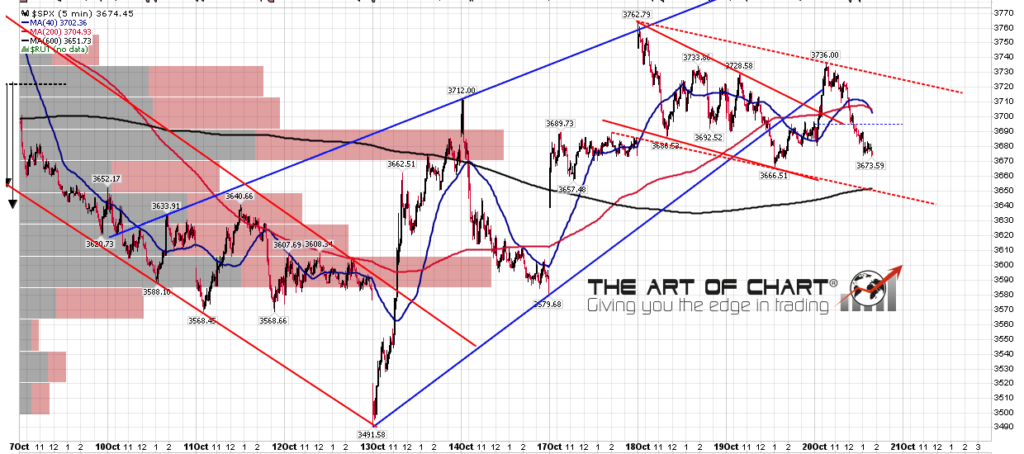
I’m leaning towards seeing a retest of the current high at 3762.79 before the likely next leg down to 3491.58 begins.
My next post should be on Monday or Tuesday before the open. Everyone have a great weekend. 🙂
 20th Oct 2022