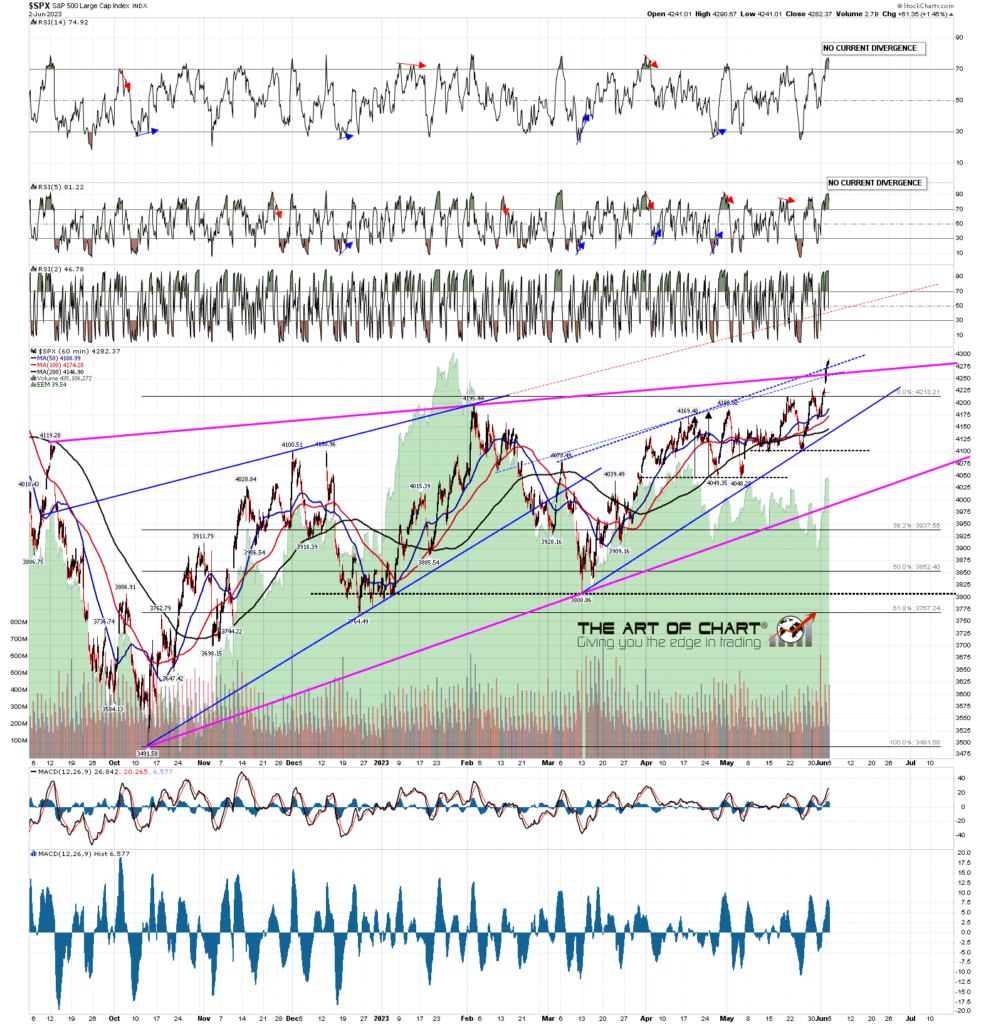
In my premarket video on Tuesday I was looking at the setup and the historical stats and, was saying that a consolidation was likely to start the week and, then we would see what the bulls could do with the very bullish historical stats on Thursday and Friday. Well, they came, they saw, and they have conquered so far, so as it stands we now have the start of what could be a serious bullish break up on SPX.
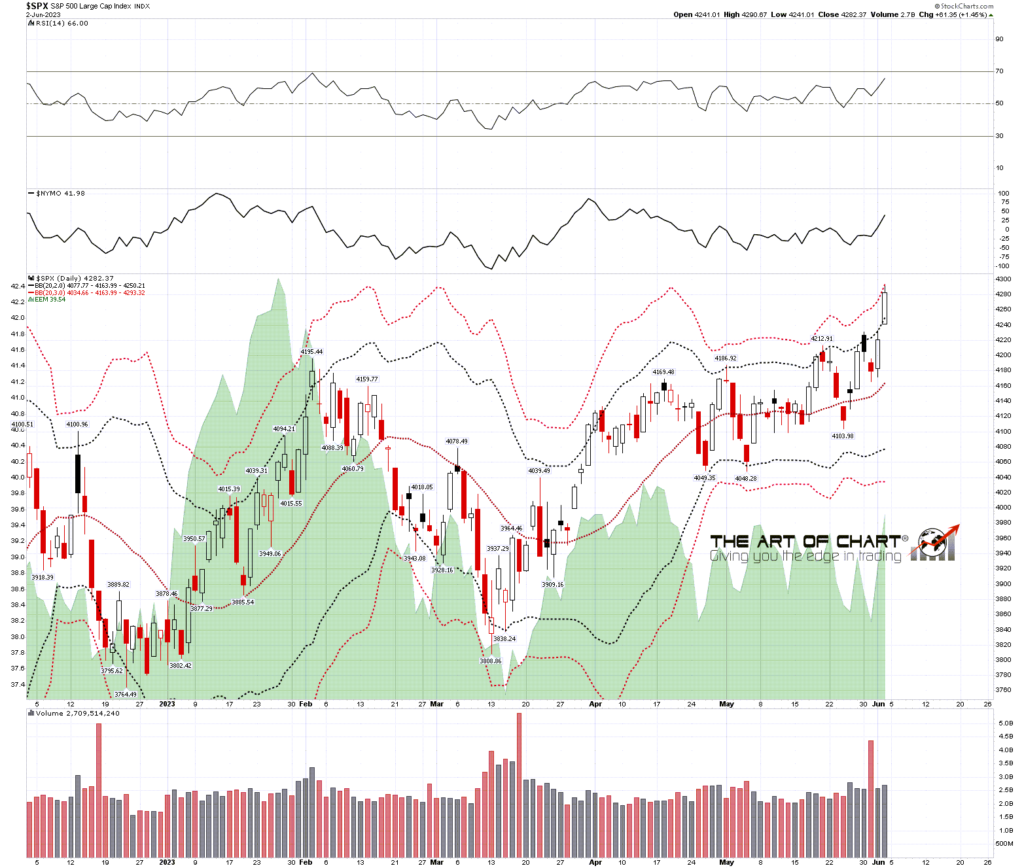
Short term though, SPX is so stretched that the high on Friday was only three handles below the close on the daily 3sd upper band, which is a rare event, so I did what I like to do with rare events, I looked back and crunched some numbers looking at previous examples.
There are eighteen previous instances since the start of 2007 where a move has either punched through the 3sd upper band or delivered a near miss within 0.0025% of it (10 points at nominal SPX level 4000). Excluding the punches, none of which were preceded by near misses, there are twelve instances. Of those twelve instances five of them delivered a second near miss within three trading days, usually on the next trading day. Of those two delivered a third near miss within four trading days.
In terms of what happened after that the twelve divide into:
- 1x – 4 day consolidation then continuation of the uptrend
- 6x – Forming short term high into a 2% + decline then continuation of the uptrend
- 3x – Made immediate significant high into 5% + decline
- 2x – Forming significant high into 10% + decline
The odds here are therefore 5/12 that we see a continued run that makes at least one more near miss of the 3sd daily upper band this week.
The odds here are therefore 11/12 that some kind of high is forming here that will deliver at least a bull flag retracement.
The odds here are therefore 5/12 that some kind of significant high is forming here and of that 3/12 or about 25% that high was made on Friday.
SPX daily BBs chart:
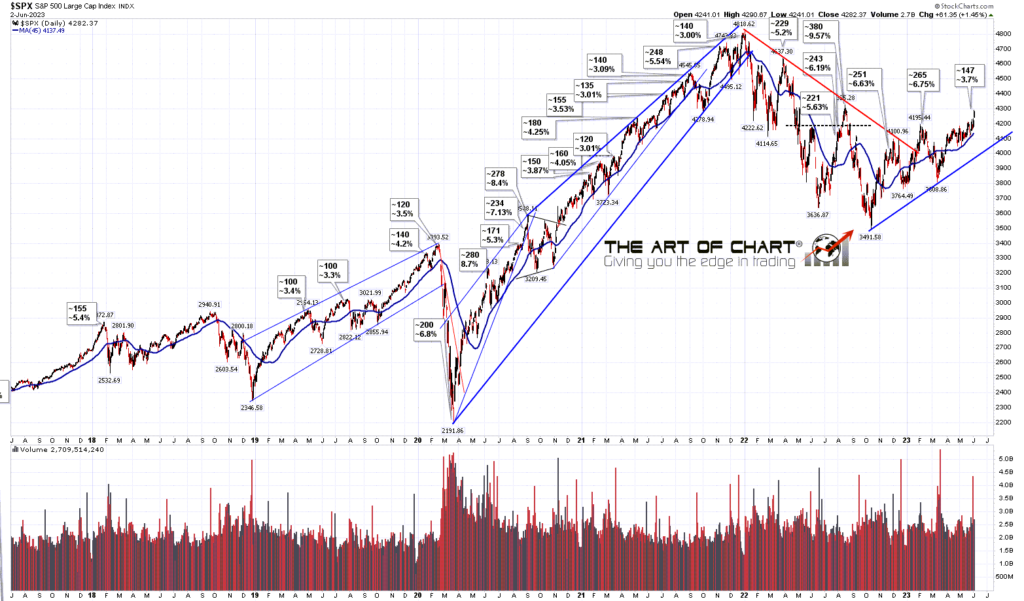
On the monthly chart SPX has now traded the month so far entirely over the monthly middle band, currently at 4153, and is also punching over the main support/resistance trendline from the 2009 low, currently in the 4250 area. If that converts to support, then the path is open for a possible retest of the all time high.
SPX monthly chart:
The stats for the rest of June lean neutral to slightly bearish overall. Thursday this week leans significantly bullish, and Wednesday and Friday both lean significantly bearish. The odds of making at least a short term high this week are at least 70% overall and the best days to make that high would obviously be today, tomorrow, or Thursday.
We are doing our free monthly public Chart Chart at theartofchart.com at 4pm EDT on Sunday 11th June looking at the usual very wide range of markets. It should be interesting. If you’d like to attend you can register for that here, or on our June Free Webinars page.
If you are enjoying my analysis and would like to see it every day at theartofchart.net, which I co-founded in 2015, you can register for a 30 day free trial here. It is included in the Daily Video Service, which in turn is included in the Triple Play Service.


 05th Jun 2023