The high last Friday was only three handles below the close on the daily 3sd upper band, which is a rare event, so I did what I like to do with rare events, I looked back and crunched some numbers looking at previous examples. These are the stats I posted on Monday morning.
There are eighteen previous instances since the start of 2007 where a move has either punched through the 3sd upper band or delivered a near miss within 0.0025% of it (10 points at nominal SPX level 4000). Excluding the punches, none of which were preceded by near misses, there are twelve instances. Of those twelve instances five of them delivered a second near miss within three trading days, usually on the next trading day. Of those two delivered a third near miss within four trading days.
In terms of what happened after that the twelve divide into:
- 1x – 4 day consolidation then continuation of the uptrend
- 6x – Forming short term high into a 2% + decline then continuation of the uptrend
- 3x – Made immediate significant high into 5% + decline
- 2x – Forming significant high into 10% + decline
The odds here are therefore 5/12 that we see a continued run that makes at least one more near miss of the 3sd daily upper band this week.
The odds here are therefore 11/12 that some kind of high is forming here that will deliver at least a bull flag retracement.
The odds here are therefore 5/12 that some kind of significant high is forming here and of that 3/12 or about 25% that high was made on Friday.
If we were going to see another near miss of the daily 3sd upper band, currently at 4370, that would generally have already been seen, but there is a small chance that we may see that today. So far all the other options listed are still on the table as SPX has not yet made a higher high, though the odds favor seeing that today. After that, at minimum the odds are 11/12 that some kind of high is forming here, and 9/12 that a high is forming here that should deliver a minimum 2% retracement. So how’s that setting up?
SPX daily BBs chart:
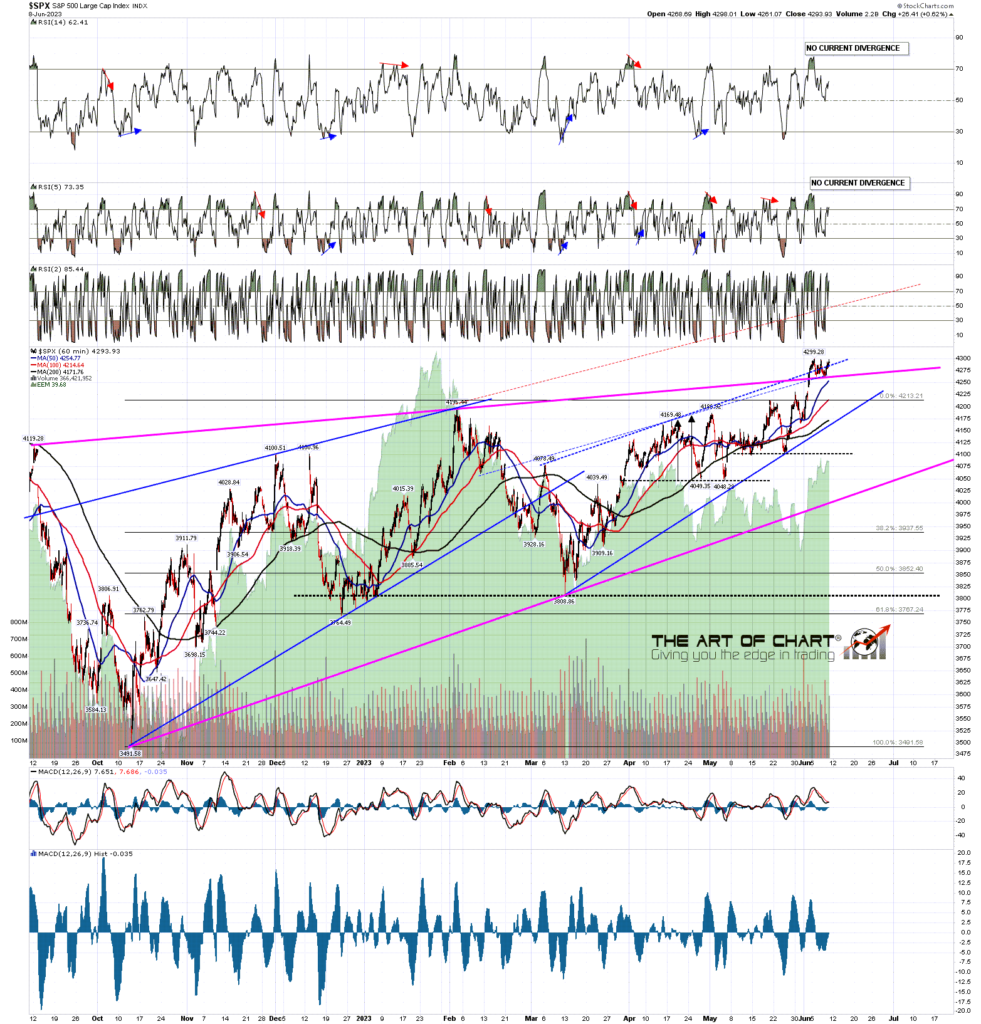
On the SPX hourly chart the action since the high on Friday looks like a bull flag forming, and the odds are that we will see a retest of that soon. Looking at the overnight action I think that would likely be this morning. As soon as that higher high is made a possible hourly RSI 14 sell signal will start brewing. A possible short term double top is forming.
SPX hourly chart:
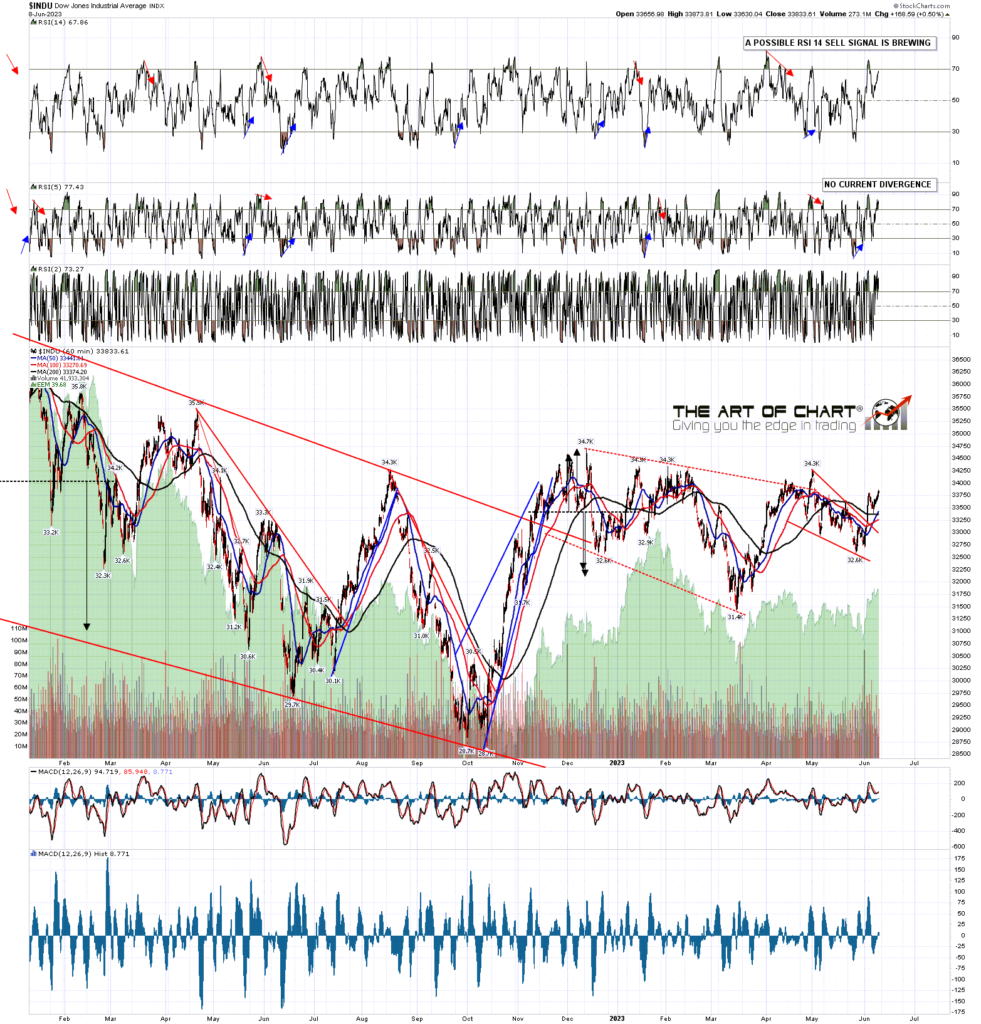
I was saying last Friday that NDX had been doing most of the bullish running, and that has changed this week, with IWM and Dow leading, then SPX and NDX at the back. The An hourly RSI 14 sell signal fixed on Monday and has already reached the possible near miss target.
A possible short term H&S is forming that may be setting up a modest further decline.
NDX hourly chart:
The historical stats for today lean two thirds bearish, though I’m not sure how much that really means on a Friday, which tends to be the least likely day to see a meaningful decline. We’ll see how it goes today, but there are high odds that at least a short term high is forming here.
One additional thing to bear in mind is that we have FOMC next week and I think the roll into the new ES contract is next week too. Those two factors may make making a short term high here a slower and more complex process. We’ll see.
I wrote most of this post before the open. Since then SPX has now retested Friday’s high as expected, so that is the pop. Next up should be a drop, so I’m watching to see whether SPX delivers that, and whether the possible hourly RSI 14 sell signals on SPX, IWM and Dow can fix today. The SPX daily upper band is now in the 4327 area and I’d be looking for resistance there. Everyone have a great weekend. 🙂
We are doing our free monthly public Chart Chart at theartofchart.com at 4pm EDT on Sunday 11th June looking at the usual very wide range of markets. It should be interesting. If you’d like to attend you can register for that here, or on our June Free Webinars page.
If you are enjoying my analysis and would like to see it every day at theartofchart.net, which I co-founded in 2015, you can register for a 30 day free trial here. It is included in the Daily Video Service, which in turn is included in the Triple Play Service.


 09th Jun 2023