Tomorrow is the last trading day of 2020 and with new Year’s Day on Friday we get another long weekend into the start of 2021 next week. This has been a really interesting year, though a very hard one for many, and will leave a legacy for economies and markets that will likely ripple through the next few years. We’ll see how that develops in 2021.
At the end of every year we like to do a free public webinar or two at theartofchart.net looking at where we see markets going over the next year, and we are doing the ones for next year tonight and tomorrow. All are welcome and the first webinar we are running is at 5PM EDT tonight (Wednesday 30th January) looking at equity indices, FAANG stocks and key sector ETFs and, if you’d like to attend, you can register for that here. The second webinar is at 5PM EDT tomorrow (Thursday 31st January) looking at commodities including metals, energies, softs, meat and grains and, if you’d like to attend, you can register for that here. As always all webinars are linked from our monthly free webinars page at our blog, currently December.
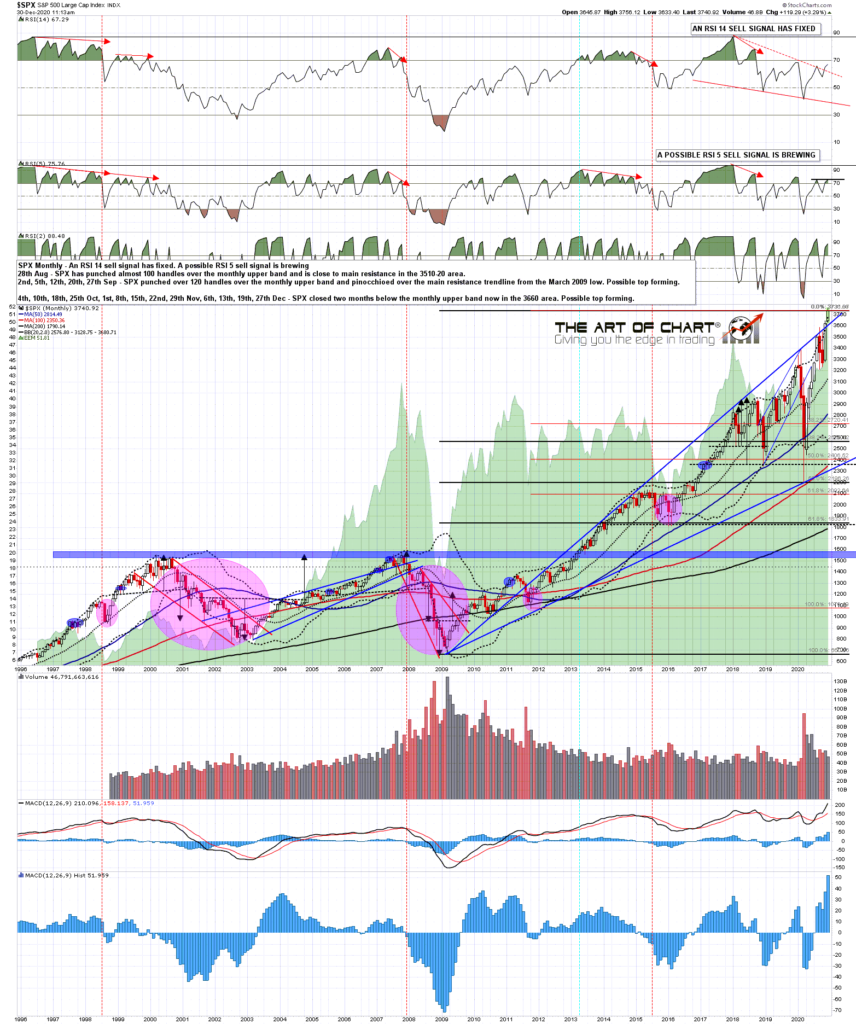
In the short term we are seeing a slow, low volume end to the year, and markets are looking very stretched here. At the time of writing SPX is over 1.5% over the monthly upper band and would need to decline over 16% to retrace to the monthly middle band in the 3130 area. That is extreme though I’d note that IWM is even more stretched, currently an eye-watering 8% over the monthly upper band and 25% over the monthly middle band. The odds favor a large retracement starting soon, and that may start next week.
SPX monthly chart:
In terms of the setup for making a short term high here that is now very attractive and there is a very attractive case too that equity indices are topping out here before a retracement that might well look for backtests of those monthly middle bands.
On the SPX daily chart the main support is the daily middle band, currently at 3694. On a break below and conversion of that level to resistance a significant high may well be in, barring a retest or two to make topping patterns. That high might last through much of all of 2021, and we’ll be talking more about that tonight, and talking tomorrow night about why we are looking for a solid bull run in commodities in 2021.
SPX daily chart:
On the SPX 60min chart the last new all time high delivered a slight overthrow of the rising wedge resistance trendline. I’m expecting the retracement back to rising wedge support, currently 3490 area, to start shortly, and the bearish overthrow is telling us to expect that to break, opening a possible move back to the monthly middle band.
SPX 60min chart:
NDX is looking toppy here, with a possible daily RSI 5 sell signal brewing and well established support at the daily middle band, now in the 12617 area. There is no obvious overall pattern from the March low but a decent rising wedge from the November low is topping out here.
NDX 60min chart:
Dow has been topping out within the very nice rising wedge from the March low for six weeks or so now. The last new all time high has now also slightly overthrown, so that too is looking very toppy here.
INDU 60min chart:
Years regularly start with strong declines in the first couple of weeks of the month and there is a very decent setup for that here. Could markets hang around here a while longer, or even break up? Sure, anything is always possible, but the odds favor lower.
We are running our next Trader Boot Camp starting 18th January and this is extremely competitively priced and covers a lot of territory. If you’re interested you can read more about that here.
Lastly we are running our December sale for memberships at theartofchart.net until the end of the year, and that offers annual memberships with four free months rather than the usual two. We won’t be running another of these sales until at least July, so if you are interested you should get this done before the end of December. You can find the page for that here.
Everyone have a great holiday weekend and a very Happy New Year! 🙂


 30th Dec 2020