In my post earlier this week I was talking about my post of 6th August 2021 when I was looking at the possibility that there would be a retracement this year to backtest a major broken resistance trendline on SPX, and the possible very bullish setup that a good retest would partially confirm, and I said I would look at that in more detail in my next post.
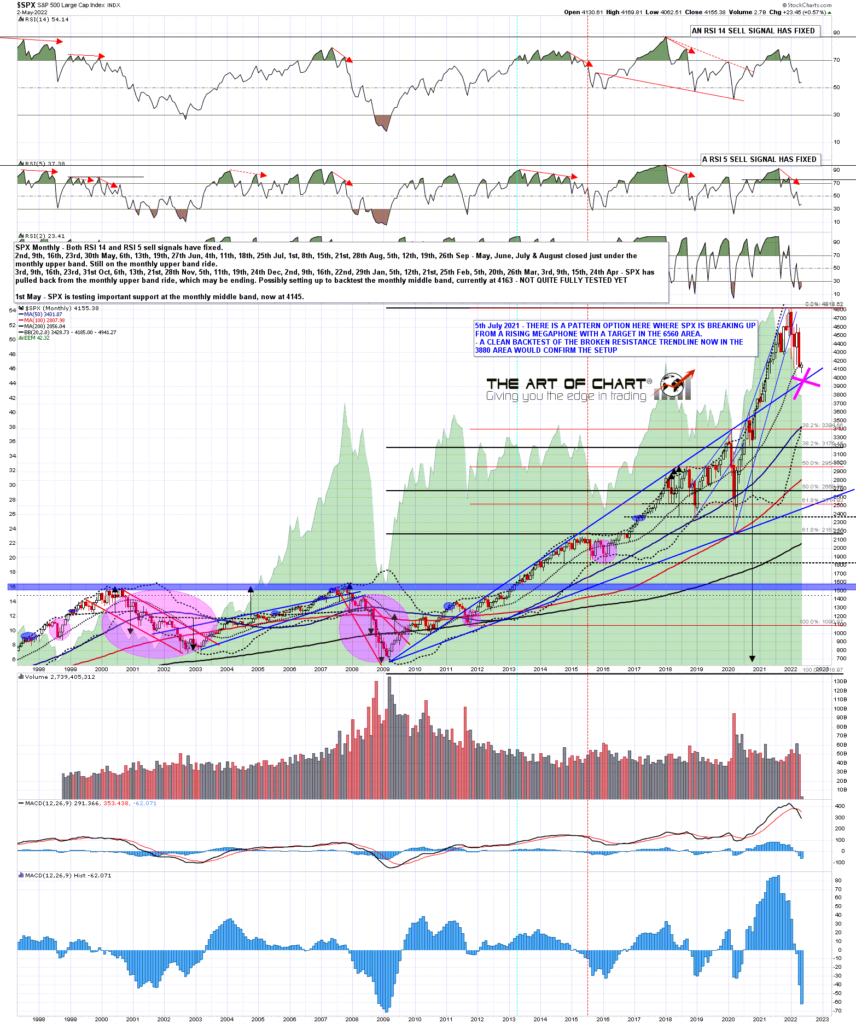
The trendline is the main resistance trendline on SPX on SPX from the low in 2009, shown on the chart below, and it was and is a really good trendline. The start was at the 2009 low, with touches at the lows in 2010, and highs in 2011, 2012, 2013, 2014, 2017, 2018 and 2020. It was so strong that I was expecting it to hold indefinitely until it broke in the wild move up after the 2020 low. This is the trendline I am looking to be backtested.
So what’s the pattern setup? Well, the corresponding support trendline was only two touches at the point it broke down in 2020, so if that was rising megaphone support, then the 2020 crash delivered a decent 50% retracement of the move up from the 2009 low and that may have been be the resolution and end of that pattern. There is however a possibility that the 2020 move established a new rising megaphone support trendline, and that is supported by the way that the resistance trendline broke at the end of 2020, with first a monthly test, then another monthly test with a poke above and close below at the end of the month, and then the break and monthly close above on the third test of the trendline.
Why is this important? Well if that break was a break up from a rising megaphone, then that sets up a potentially very bullish move if that is confirmed by (first), a fairly precise retest of the broken trendline that holds then (second), a new high that converts the old high into support. If seen, that is then a confirmed break up from the larger rising megaphone target with a high probability target in the 6560 area.
These rising wedge or megaphone targets when they break up and backtest cleanly are rare, as these generally break down, and if there isn’t a clean backtest then something else may well be happening, but when they break up in the right way I have found that they have a very good chance of making target, well over 80% in my experience. I have a past example that I called a few years ago on SPX that I’ll look at to illustrate how these work.
SPX monthly chart:
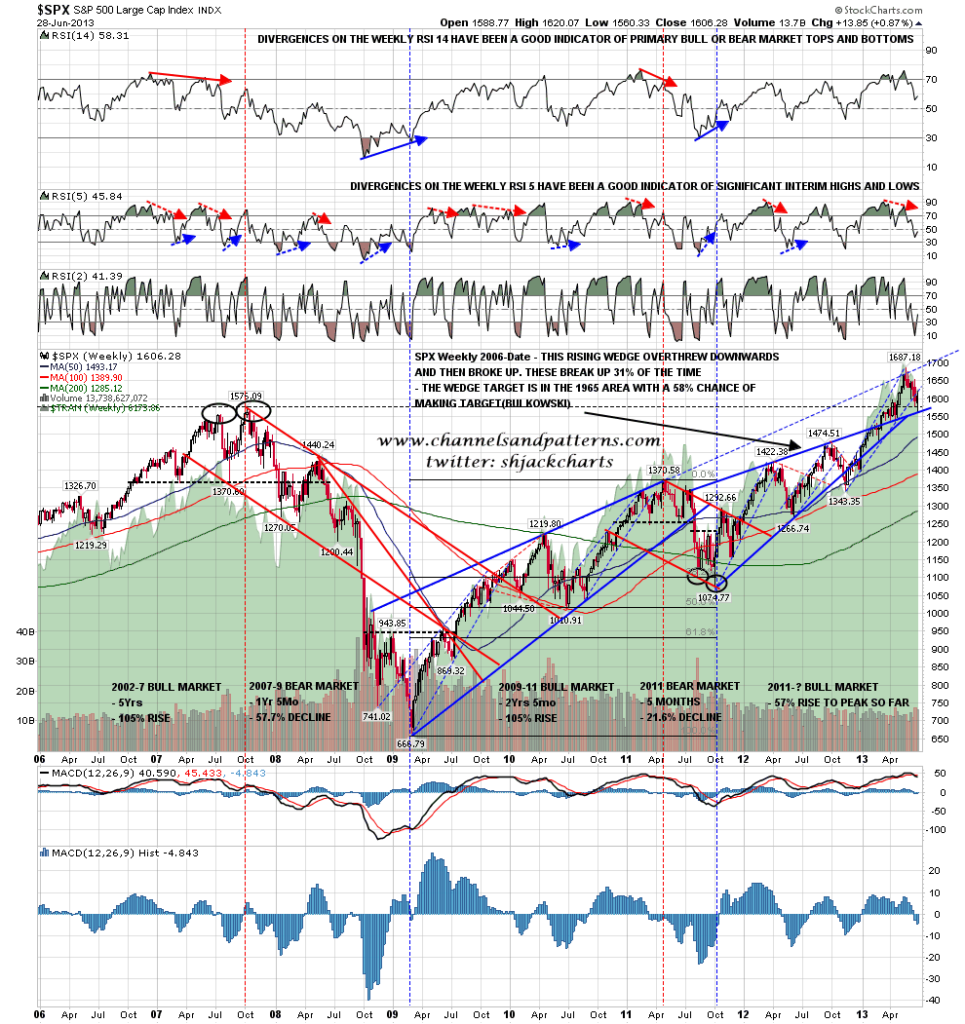
This example is from a special post I published on 30th June 2013 called ‘Brave New World Series: 3 – The SPX Rising Wedge Target at 1965‘. Some of my long term readers may well recall it.
In that post I showed the chart below, with the rising wedge on SPX that had broken up and backtested perfectly though it had not yet made a new high and converted the old one to support. The backtest however was also a conversion of the 2007 all time high at 1576.09 to support. That target at 1965 was then made a year or so later in 2014, a move up of 25% from the backtest.
The current setup would be a larger move, with a 66% or so move up from the backtest, but with the last impulse up from the 2020 low having delivered a 125% increase on SPX, then that doesn’t seem too far from the realms of possibility.
There is also a possibility of a substantial rally on bonds starting in the next few weeks that could last a year or more and that could be a good fit with this scenario. I’ll be doing another post in the next few days looking at the setup there.
SPX weekly chart (from 30th June 2013):
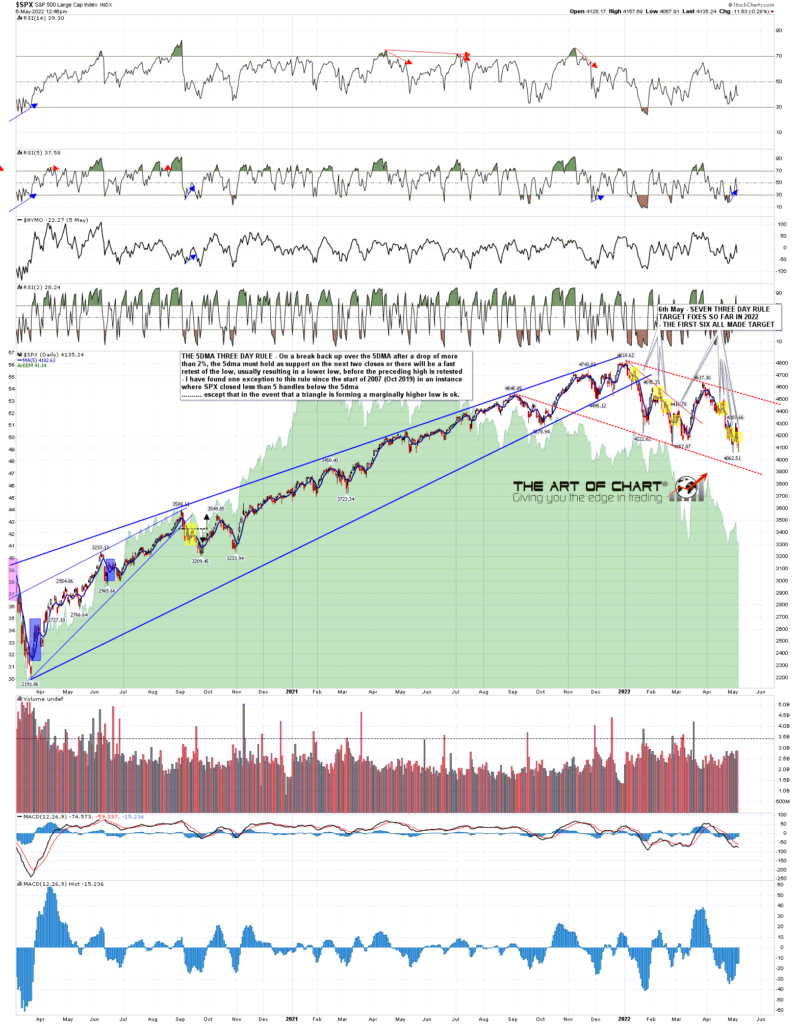
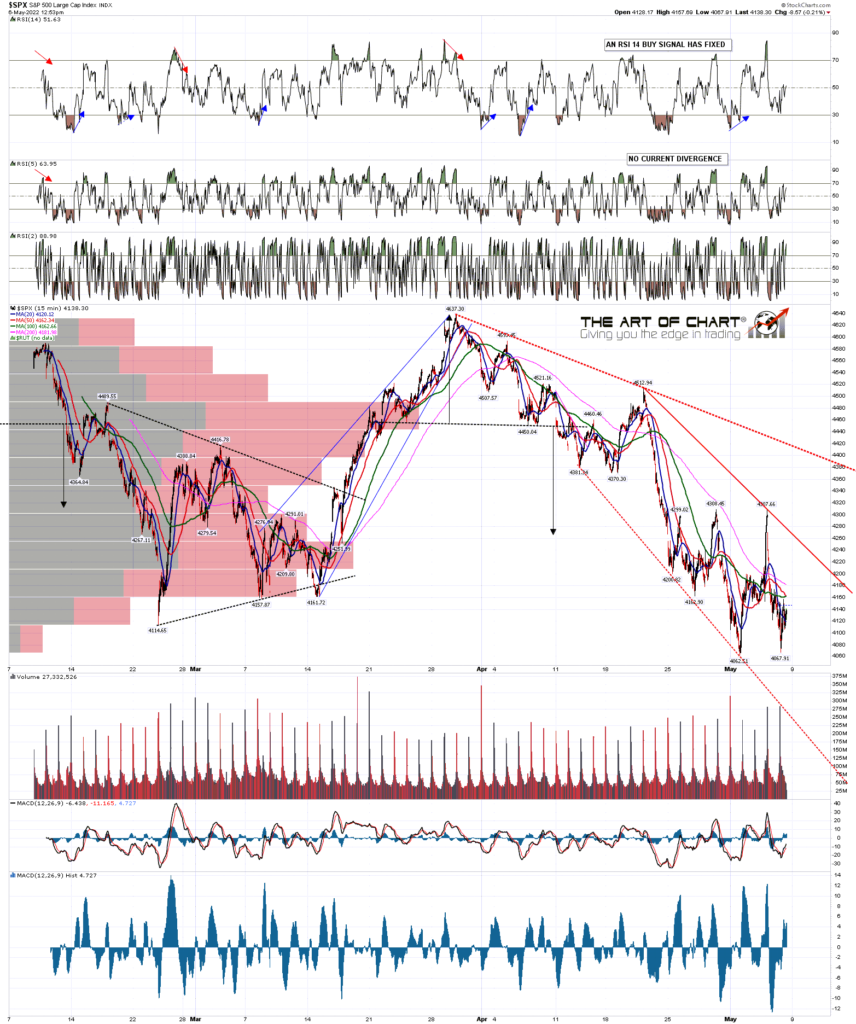
In the shorter term SPX broke up hard on Wednesday on doveish noises from the Feb, but then gave that all back yesterday. In the process there was a clear break back over the 5dma, putting SPX back on the Three Day Rule, then a clear close back below it fixing a Three Day Rule target at a retest of the current retracement low on SPX at 4062.51.
I’ve marked the six previous Three Day Rule fixes so far in 2022, and all six made target. After a small tweak to the way I calculate this on 2019, on the new basis there hasn’t been a fail on this setup since the start of 2007, with the exception of two marginal higher lows when triangles were forming, so I am expecting to see that low retest.
SPX daily 5dma chart:
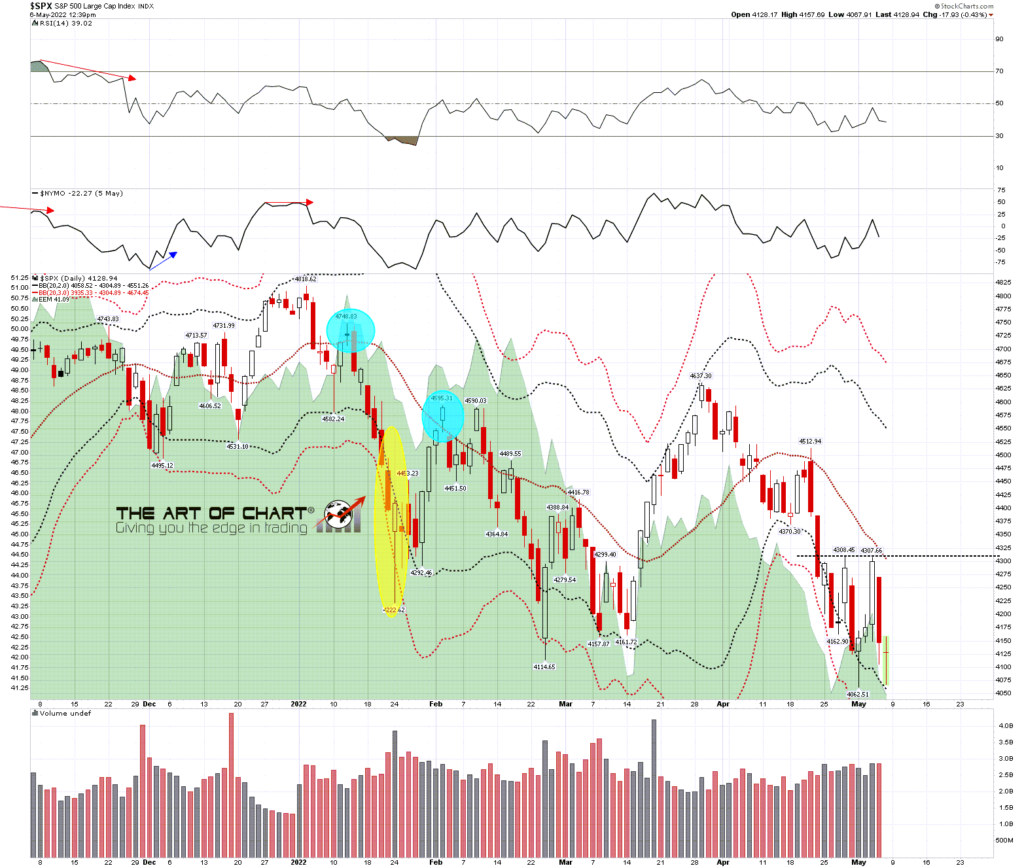
On the daily bands chart the lower band is in the right area to get tested on that retest, but I’m expecting to see SPX go at least a bit lower, probably to 4000, and potentially down to my major trendline backtest, now in the 3930-50 area, though I have some reason to think that might not be backtested fully until June.
SPX daily BBs chart:
The bottom line here is that a new retracement low on SPX is very likely, and there are some attractive targets not far below when that happens, most likely next week.
We are doing our usual monthly free public Chart Chat at 4pm EST on Sunday 8th May. We’ll be looking in more detail at our equities retracement scenario there, as well as covering the usual wide range of instruments and markets. If you’d like to attend you can register for that here. As always you can also register for this on our current free monthly webinars page.

 06th May 2022