Well, SPX has finally retraced over the last couple of days, and the bull/bear line that I’m talking about on the video is rising support from the April low. That was tested as expected not long after I recorded the video and that’s holding so far. On a break below, this rally has likely ended unexpectedly early. If it holds, then SPX should do another leg up into the 2730s and triangle resistance there. I’m leaning towards another leg up unless that trendline support breaks. We shall see. Intraday Video from theartofchart.net – Update on ES, NQ, and TF:
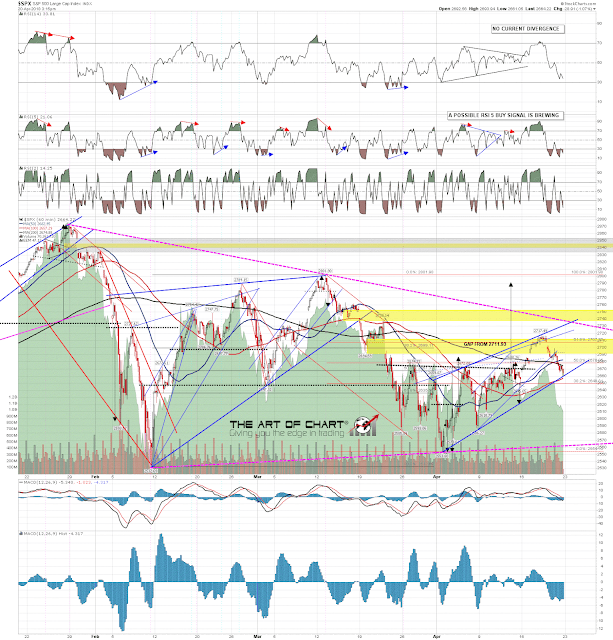
Here’s the overall triangle setup on SPX. SPX 60min chart:
Everyone have a great weekend. 🙂
 20th Apr 2018
I noticed you say we presently have a small falling megaphone on SPX and, I ask out of ignorance not dispute,
why did you anchor the beginning of the support line where you did ? It seems to my ignorant mind that it begins neither here nor there; not at a high nor at a low. Perhaps it is the top of the gap at 2711 ? Could you explain why it is anchored there ?
How far below the current support would you say it could fall before becoming something entirely different than the move up you expect next ?
Hope your weekend was spring like, here in NyC we finally have something resembling that but it is as baffling as the markets to most here.
Cheers,
Thank you