I was saying yesterday that I was expecting the decision in yesterday’s inflection point to be made fairly quickly and so it was. The smaller NDX H&S pattern I showed broke down at the open this morning and has now made target.
NDX 5min chart:
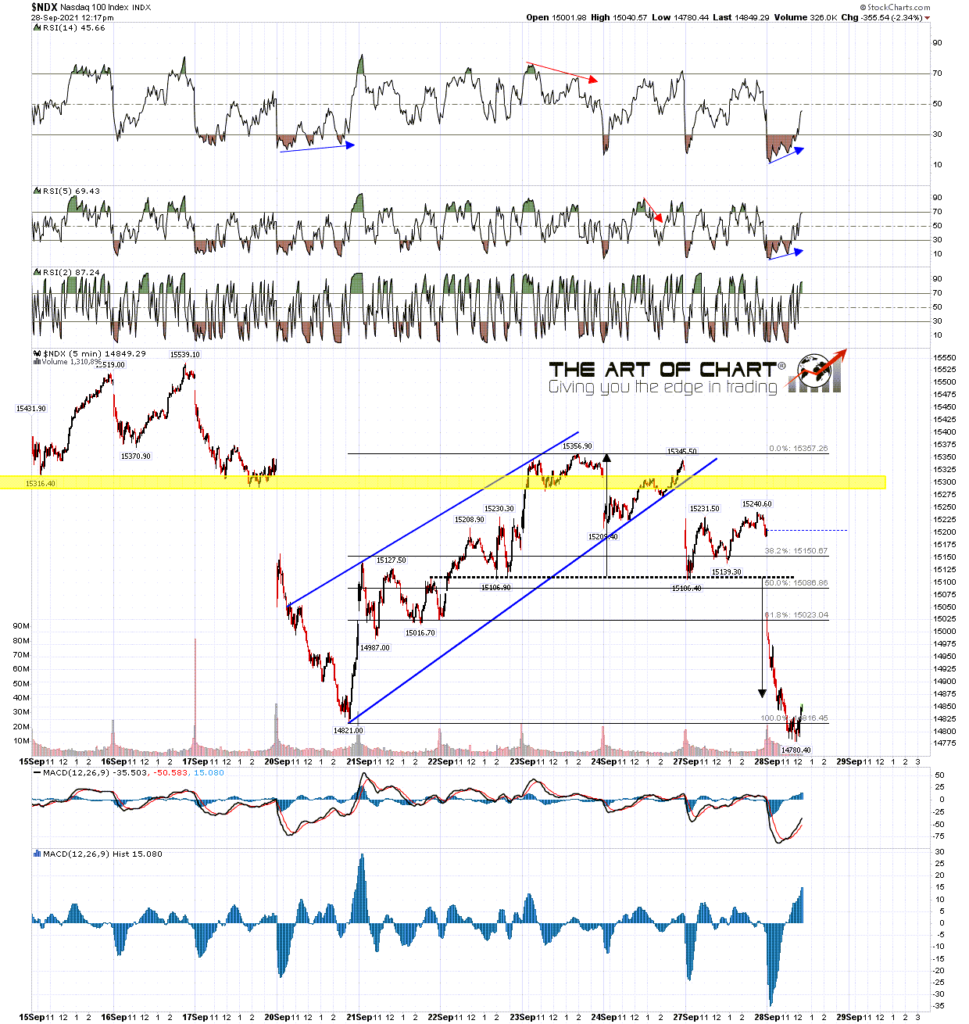
That has completed the larger H&S pattern on the hourly and daily charts and that has broken down slightly with a target in the 13840 area. The important rising support trendline from the March 2020 low has broken this morning so the way to that H&S target is now open although ……..
…….. as my longer term readers will know every time one of these H&S or double tops breaks down there is a new inflection point where the market can reject back into the previous high. The marker on an H&S is at the right shoulder high, so a break back over 15345.90 at this stage would trigger a high probability target at a retest of the all time high. Something to be aware of.
NDX 60min chart:
On SPX the next obvious trendline support is at possible falling wedge support, currently in the 4285 area. A break below opens the possible H&S neckline target in the 4250 area, which would be my preferred target area for this move.
SPX 60min chart:

On the SPX daily chart possible support at the daily middle band at 4345 is being tested at the time of writing and I would note that the daily 3sd lower band is currently at 4297 which tends to be a strong support level and may mean that the 4250 area is hard to reach before next week. If we see a punch below it into the ideal target area, then then would normally be followed by at least a strong rally.
SPX daily chart:

On the SPX bigger picture today has seen the weekly middle band, currently at 4361, tested for a second week, making this the second time that has been seen since the March 2020 low, with the other instance being in October 2020 just before a serious low. That is possible support, and adds to the NDX H&S inflection point here.
SPX weekly chart:

There is a possible inflection point here but it will likely break. The next big inflection point on SPX looks likely to be in the 4230-50 area. If that target is reached this week we would likely see at least a big rally start there. If that larger H&S on SPX is forming, then the ideal right shoulder high would be in the 4470 area, which therefore may be tested again in the not too distant future.
An hour after the close on Thursday we are holding our monthly free public webinar on on the big five and key sectors at theartofchart.net and will looking at the usual six big tech stocks and eleven sector ETFs, many of which are looking particularly interesting here. If you’d like to attend you can register for that here, or on our September Free Webinars page.
There is another thing I forgot to mention in my post yesterday, and that is that every few months we run a Trader’s Boot Camp trading course at theartofchart.net, and the next one is starting next week. In my view this both one of the best and cheapest online trading courses available anywhere and if you’re interested you can look at that here.
 28th Sep 2021