As I was saying in my last post on Monday, the all time high on SPX a few days before was at an impressive 5.54% over the 45dma and, excluding the spike up after the low last year, was one of the highest against the 45dma in the last decade. This is a good indication that SPX is topping out for at least a reversion to the mean move, that mean being the 45dma, currently in the 4517 area.
I was looking for retests of the high on SPX and NDX particularly to set possible daily RSI 14 sell signals brewing, and so far NDX has made a new all time high as expected, and ES (the SPX future) has also made a new all time high on Thursday night. SPX has failed to make a new all time high by less than one handle on Friday but we may well also see that on Monday, at which point a daily RSI 14 sell signal will also start brewing, joining the ones already brewing on ES, NDX and NQ.
SPX daily vs 45dma chart:

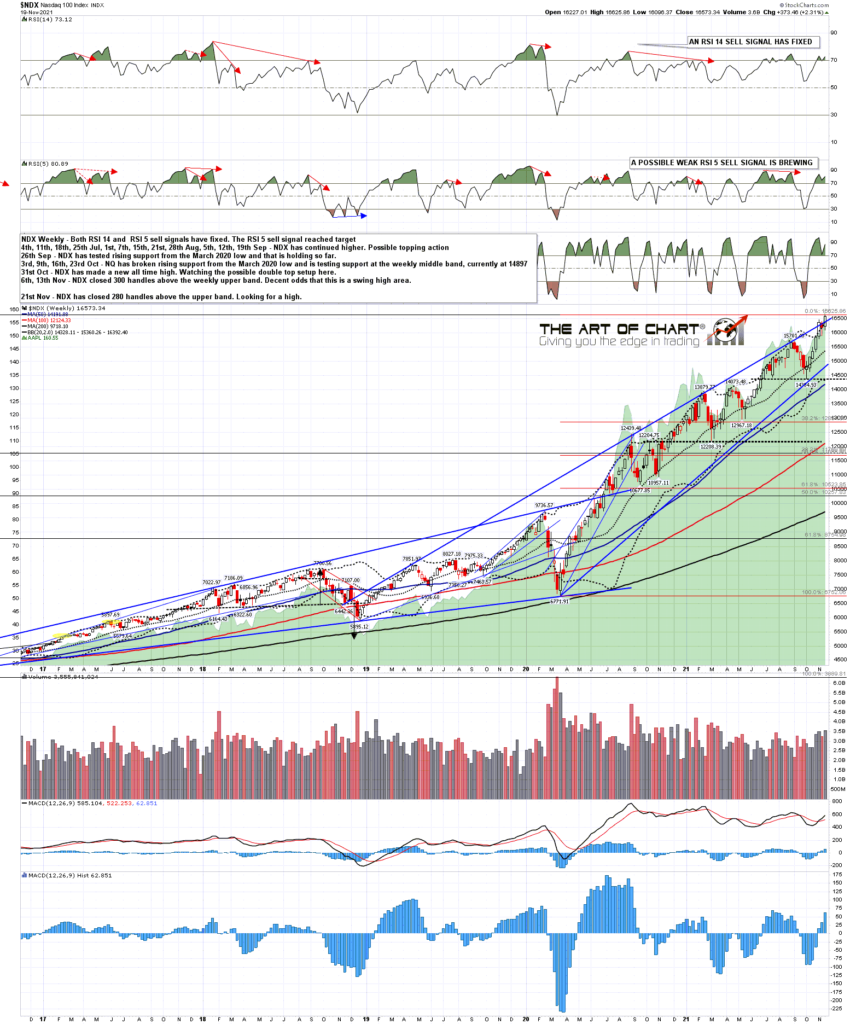
NDX looks very promising for a high being made in this area, as it punched 300 handles over the weekly upper band at the all time high made two weeks ago, and closed 280 handles above again on Friday. this has historically been an excellent indicator for at least a short term high being made or very close.
NDX weekly chart:
Are there any indications that equity indices might nonetheless break a bit higher in the short term. Yes, so there is a choice to be made here, as there so often is. On the RTY chart below you can see that while SPX/ES and NDX/NQ have been retesting the highs, a decent looking bull flag has been forming on RTY that may be setting up a high retest on RUT/RTY. If seen then a possible daily RSI 14 sell signal would start brewing there too.
RTY Dec 60min chart:

Exactly the same can be seen on and said of the Dow/YM chart. Again I am wondering whether this may be setting up a high retest.
YM Dec 60min chart:

Is there an obvious target above on SPX that I would be looking for in the event of a break higher next week? Yes. There is a clear resistance trendline above on SPX currently in the 2760 area, and if seen, I’d be looking for resistance there.
SPX 60min chart:
Could a larger high be forming here? Yes, and I’d refer back again to the backtest scenario that I was looking at in my post on Friday 6th August. This could well be setting up for that backtest here and I’ll be watching the next retracement with great interest.
We are running our monthly public Chart Chat at theartofchart.net today at 4pm EST and if you’d like to attend you can register for that here , or on our November Free Webinars page. We will be looking at the setup on equity indices here as well as the usual very wide range of other instruments. We will also be looking ahead into the first six months of next year.
There is another thing I’d like to mention. I’m developing a new daytrading room with my long term daytrading collaborator Paul Buckles. That’s in late beta at the moment and I’m looking for a few of my longer term readers who daytrade to come and join us while we are making this ready for market. Obviously there would be no charge and we will be explaining our methods, which are mainly mathematical, as we do this. For any who then want to join when we launch the room there will be a reward in the form of a special discount for them. If you’re interested email me on springheeljack666 at gmail dot com.
 21st Nov 2021